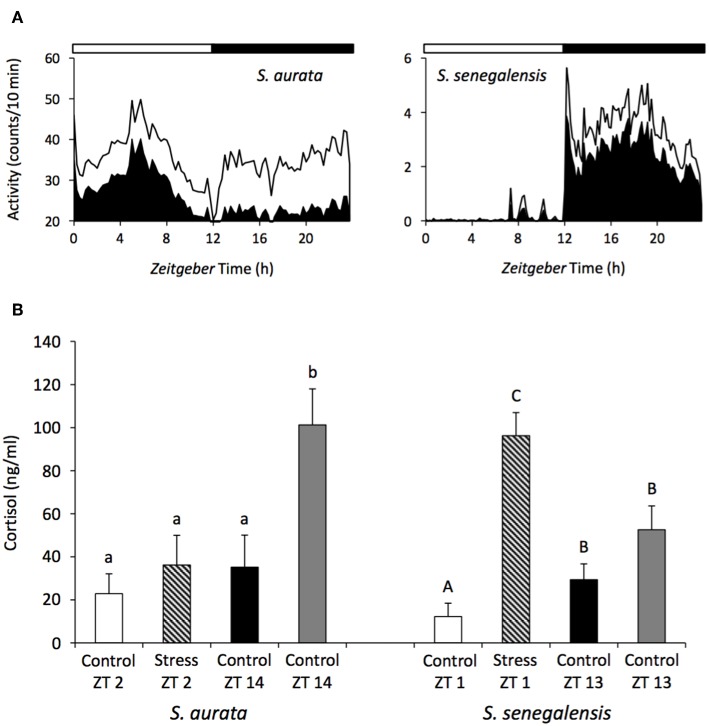
Figure 3.
Daily rhythms of locomotor activity (A) and differences in the cortisol response depending on the time of the day (B) in the gilthead sea bream and Senegalese sole. The black area in the waveforms represents the mean values of activity and the continuous line the S.D. White and black bars above the waveforms represent the light and dark period, respectively. A stress challenge was applied to both species, consisting of air exposure during 30 s, at different time points of the LD cycle: ZT2 and 14 h for sea bream, and ZT1 and 13 h for sole. Fish were sampled 1 h after the stress and cortisol was evaluated. Unstressed control groups were sampled at all-time points. Different letters indicated significant differences between groups (ANOVA, p < 0.05) (small case letter for sea bream and upper case letters for sole). Modified with the permission of authors from López-Olmeda et al. (83) and Vera et al. (88).

