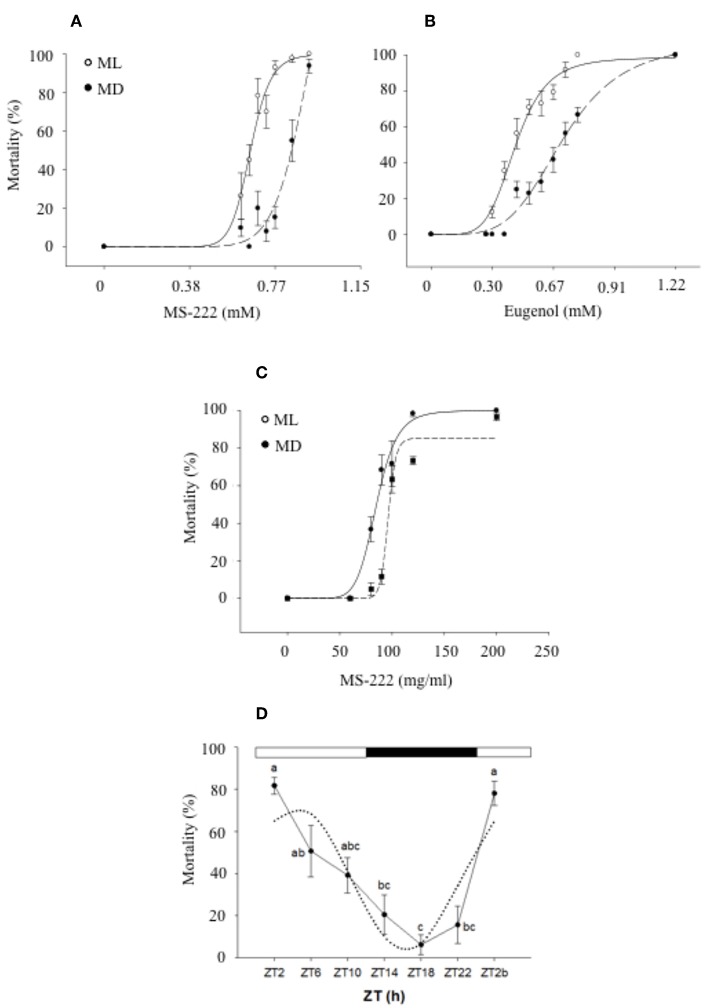
Figure 4.
Daily variations of mortality of zebrafish exposed to different MS-222 (A) and eugenol (B) concentrations after 15 min exposure at mid-light (ML; white circles) or mid-dark (MD; black circles) [with the permission of authors from Sánchez-Vázquez et al. (171)]. Sea bream mortality after 15 min exposure to different MS-222 (C) concentrations at ML or MD [with the permission of authors from Vera et al. (172)]. A logistic curve (dotted lines) was fitted to mortality rate (six independent replicates with n = 8). (D) Daily rhythm of mortality of zebrafish larvae exposed to 5% ethanol for 1 h. Different letters indicate significant differences (ANOVA I, p < 0.05), while the dotted black line represents the sinusoidal function fit (Cosinor analysis, p < 0.05).

