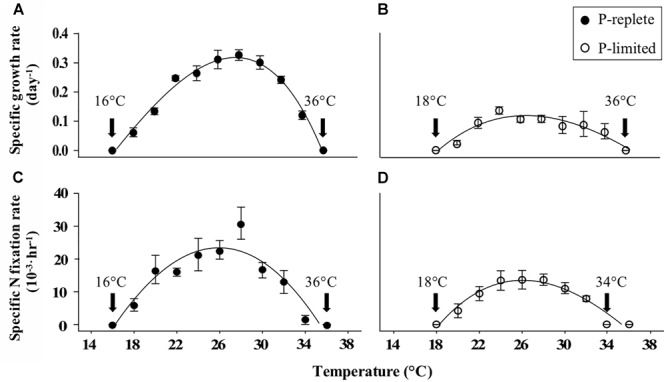
FIGURE 1.

Measured thermal response curves (TPC) based on growth rates of Trichodesmium erythraeum strain GBRTRLI101 under (A) P-replete (solid symbols) and (B) P-limited (open symbols) conditions. Nitrogen fixation rates normalized to PON are shown in (C) P-replete and (D) P-limited cultures at nine temperatures. Values and error bars represent the means and the standard deviations of triplicate cell cultures in each treatment. The arrows labeled with temperature values show the temperatures where growth or N2 fixation was not detectable.
