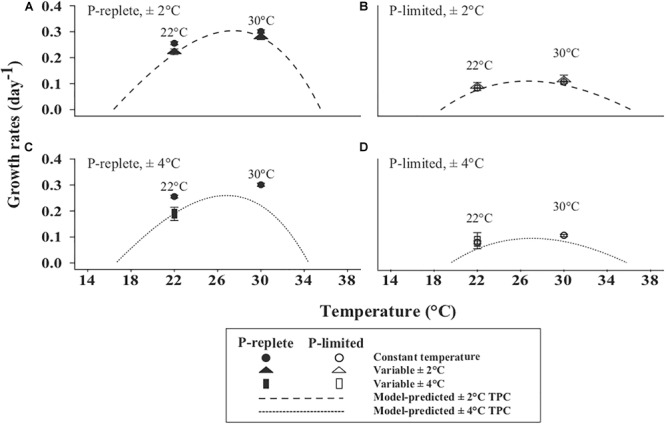
FIGURE 2.

Non-linear averaging model-predicted TPCs for the ±2°C (dashed line) (A,B) and ±4°C (dotted line) (C,D) treatments. (A,C) are under P-replete conditions and (B,D) under P-limited status. The actual measured growth rates of constant 22 and 30°C (solid cycle: P-replete; open circle: P-limited), ±2°C (solid triangle: P-replete; open triangle: P-limited) and ±4°C (solid rectangle: P-replete; open rectangle: P-limited) variable treatments are shown.
