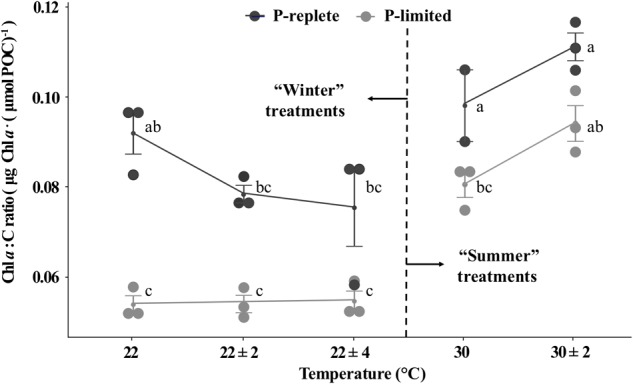
FIGURE 4.

Chl a to C ratios of Trichodesmium GBRTRLI101 at five constant and variable temperature treatments and two P conditions (light gray symbols: P-limited culture, 0.2 μmol/L; dark gray symbols: P-replete culture, 10 μmol/L) in summer and winter experiments. Values and error bars, respectively, represent the means and the standard deviations of triplicate cell cultures under each treatment. The letters represent the significant differences based on the grouping results of the Tukey multiple comparison among ten temperature × P treatments.
