Figure 2.
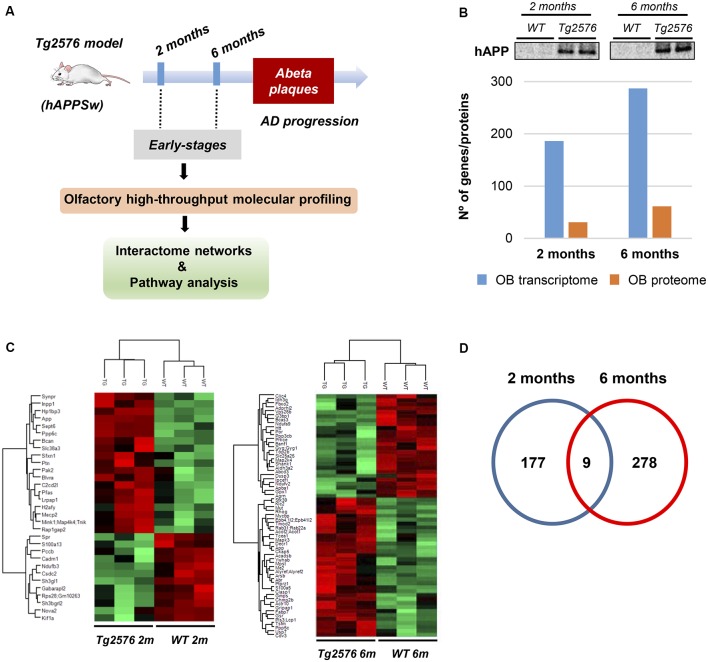
Dual-omic approach to characterize the OB molecular homeostasis between 2-month-old and 6-month-old Tg2576 mice. (A) An overview of the experimental workflow used in this study. (B) Differential molecular profiling detected by-omics in Tg2576 OBs (2 and 6 months of age). The OB protein expression levels of amyloid precursor protein (APP) at early Alzheimer’s disease (AD) stages in Tg2576 mice is shown. (C) Heat maps representing the degree of change for the differentially expressed proteins (Supplementary Table S2) between 2-and 6-month-old Tg2576 mice respect to wild-type (WT) littermates. Red and green, up- and down-regulated proteins, respectively. (D) Venn diagram for the differentially expressed genes detected in Tg2576 mice at both time points (Supplementary Table S1).

