
Figure 4.
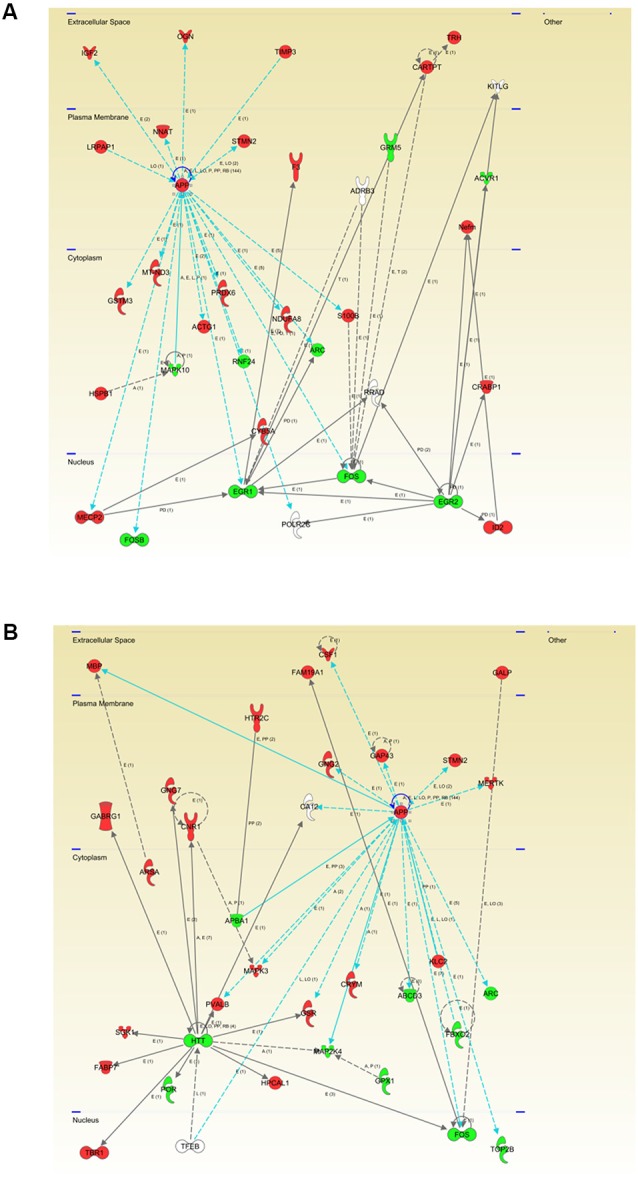
Modulation of the APP functional interactome in Tg2576 mice at the level of OB. Adaptation of APP functional network in Tg2576 OBs at 2 months of age (A) and 6 months of age (B). Relationships between differential expressed genes/proteins and APP functional interactors are represented with blue lines. Continuous lines represent direct interactions, while discontinuous lines correspond to indirect functional interactions. Up-regulated molecules in red, and down-regulated molecules in green (See complete legend at: http://qiagen.force.com/KnowledgeBase/KnowledgeNavigatorPage#).