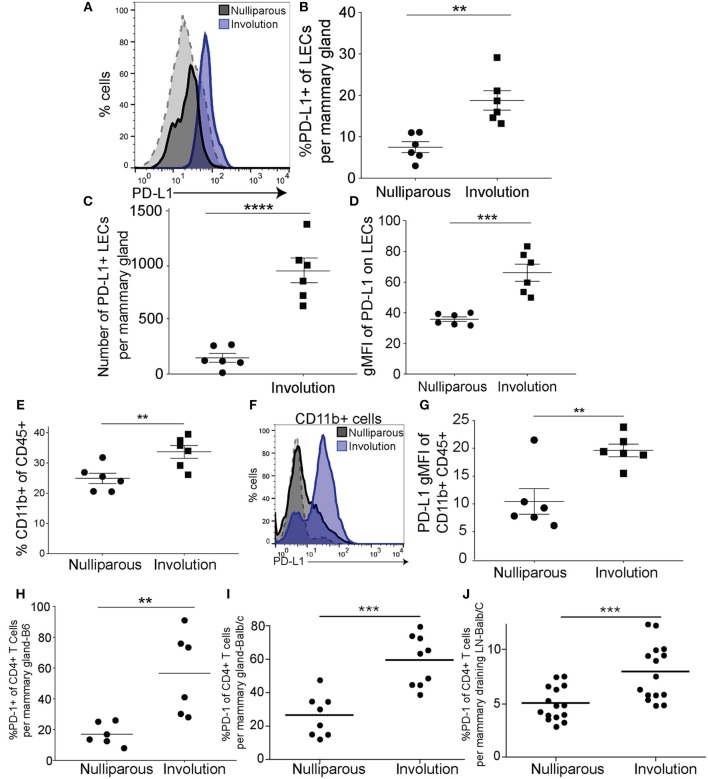
Figure 3.
PD-L1+ lymphatic endothelial cells and PD-L1+ myeloid cells increase in the mammary gland during post-partum involution. (A) Representative histogram of PD-L1 by lymphatic endothelial cells (CD45−EpCAM−CD31+PDPN+PD-L1+) acquired by flow cytometry from B6 mammary glands of nulliparous (n = 6) or recently weaned, involution day 6 (n = 6), mice. Gray dotted line indicates a PD-L1 negative population (CD45+CD11b-F4/80-) that does not change. (B) Quantification of the frequency of PD-L1+ LECs of total LECs per mammary gland. (C) Number of PD-L1+ LECs per mammary gland. (D) Quantification of gMFI of PD-L1 expression by LECs from A. (E) Frequency of CD11b+ cells of the CD45+ cells found in the mammary gland in nulliparous or involution group mice. (F) Histogram of PD-L1 expression by CD11b+ cells in mammary gland of nulliparous or involution group mice. Gray dotted line indicates a PD-L1 negative population (CD45+CD11b−F4/80−) that does not change. (G) Quantification of PD-L1 expression by gMFI on CD11b+ cells as shown in F. (H) Percent of CD4+ T cells that are PD-1+ from the mammary glands of B6 mice and (I) as in H except from Balb/c mice. (J) Percent of PD-1+ CD4+ T cells in the axillary lymph nodes from nulliparous and involution group tissues. Data shown are from 1 representative experiment of 2 replicates with at least 6 mammary glands per group. Unpaired t-test: **p < 0.01; ***p < 0.001; ****p < 0.0001.

