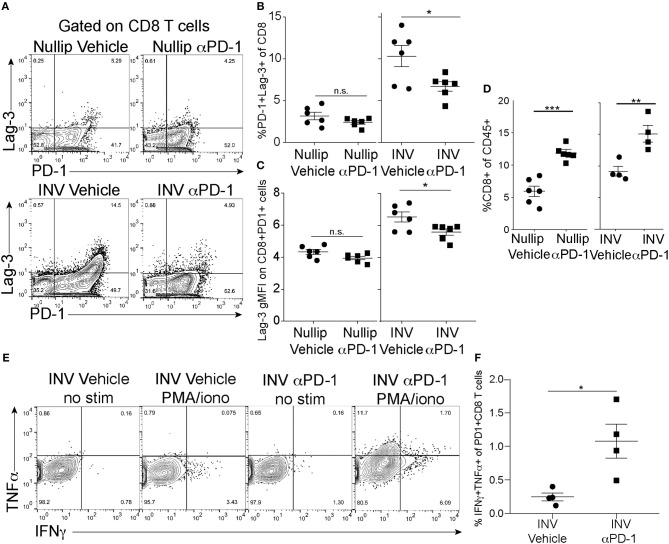
Figure 5.
Tumor Infiltrating T cells after PD-1 treatment. (A) Example flow cytometry plots of CD45+CD3+B220−CD8+ T cells from each treatment group. Shown is expression of Lag-3 and PD-1. (B) Frequency of CD8+ T cells that express both PD-1 and Lag-3 as shown in A-upper right quadrant. (C) gMFI of Lag-3 on PD-1+ CD8+ T cells (upper right quadrants in A). (D) Frequency of CD8+ of CD45+ T cells in tumors treated with anti-PD-1 as measured by flow cytometry. (E) Flow cytometry plots of CD45+CD3+CD8+PD-1+ cells at end of experiment (cells from right quadrants from C) after PMA/ionomycin treatment and intracellular cytokine staining with IFNγ and TNFα. (F) Quantification of double positive IFNγ and TNFα cells from upper right quadrant in G in involution group tumors with or without treatment. Data shown are from 1 representative experiment of 2 replicates with at least 4 tumors per group. Two-way ANOVA (A). Unpaired t-test (C–G): *p < 0.05; **p < 0.01; ***p < 0.001.

