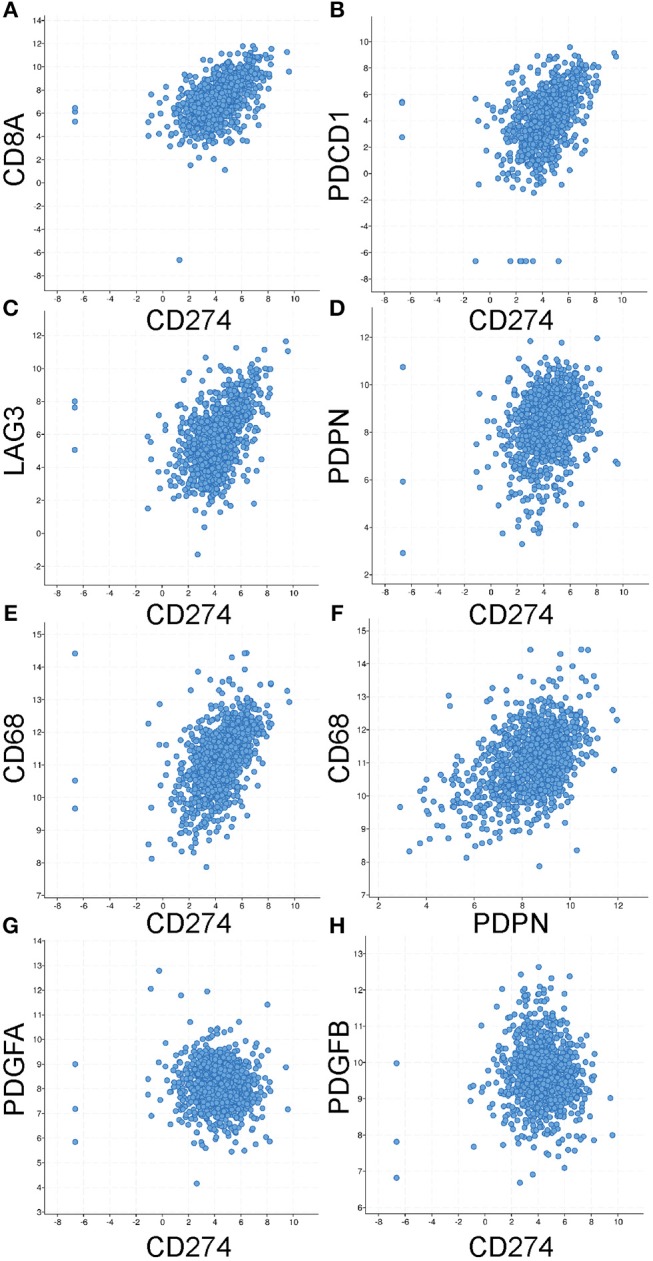
Figure 6.

Co-expression of identified markers of immune suppression in primary breast cancers. Using the co-expression tool in cBioPortal to analyze mRNA (by RNASeq) levels of multiple markers reveals significant positive correlations between CD274 (the gene encoding for PD-L1) and (A) CD8A (B) PDCD1 (the gene encoding for PD-1) (C) LAG3 and (D) PDPN and (E) CD68. As well as between PDPN and CD68 (F). No correlation was observed with (G) PDGFA, a marker of fibroblasts, or its heterodimeric partner PDGFB (H). Statistical analyses are provided in Table 1.
