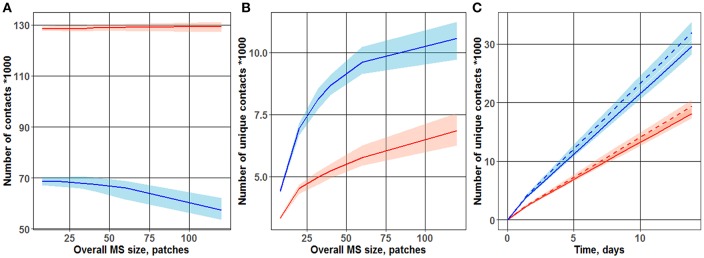
Figure 2.
Dependence of the number of total (A) and unique (B) T cell-DC contacts on overall MS size. Different cases of motion were observed for the two T cell-toward-DC motility scenarios: “random walk” and chemoattraction. Chemotaxis strength ranged from 0 (blue line; “random walk”) to 1/3 (red line). The plot is based on data from 100 simulations, each run over 3 days. Lines represent median values of contact search times; shaded areas represent 90% prediction intervals (PI). (C) Accumulation, over time, of unique T cell-DC contacts. Two motility scenarios were used, to describe T cell motion in the vicinity of DCs: “random walk” (two upper curves) vs. chemoattraction (two lower dashed curves). Red vs. blue lines reflects different overall MS size values (40 and 32 patches, respectively) used in the simulations.

