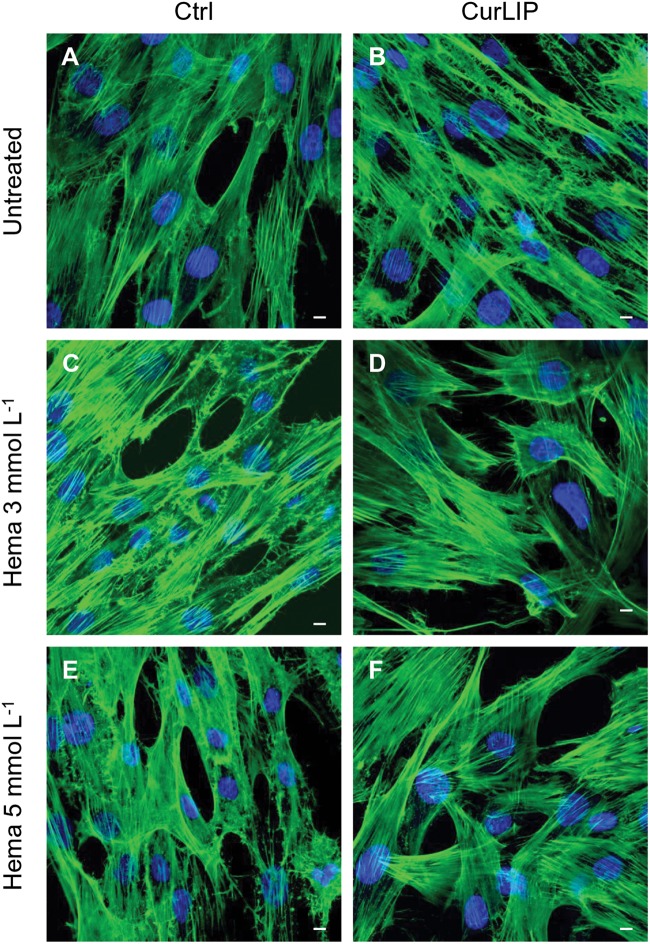
FIGURE 4.
Representative confocal images of phalloidin 488 (green) and TOPRO (blue) fluorescent staining showed cells morphology in different culture conditions. (A) Untreated cells; (B) CurLIP treated cells; (C) HEMA 3 mmol L–1 treated cells; (D) HEMA 3 mmol L–1 with CurLIP treated cells; (E) HEMA 5 mmol L–1 treated cells; (F) HEMA 5 mmol L–1 with CurLIP treated cells. Mag: 40×. Scale bars: 10 μm.

