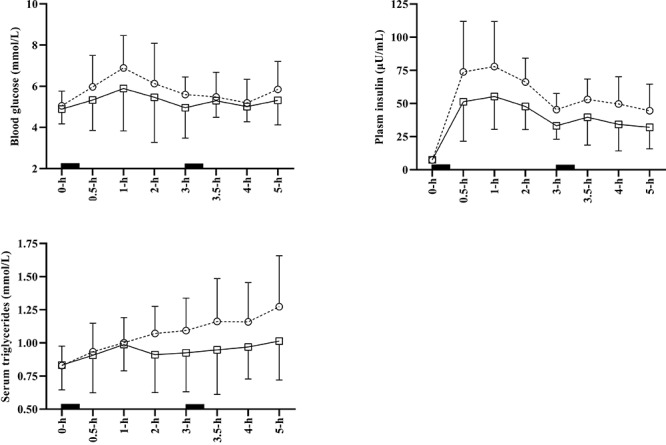
FIGURE 2.

Average time course data for glucose, insulin and triglycerides for SIT (open circles and dashed line), and WALK (open squares and sold line). Error bars indicate standard deviation and solid black squares indicate meal consumption. Some error bars have been omitted to aid clarity. SIT, uninterrupted sitting; WALK, breaking up sitting with walking.
