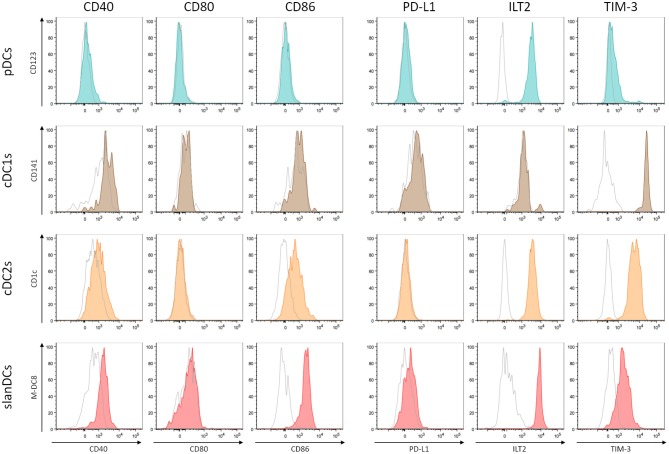
Figure 2.
Analysis of costimulatory and inhibitory molecule expression on DC subsets. The expression of 3 costimulatory molecules (CD40, CD80, and CD86) and 3 inhibitory molecules (PD-L1, ILT2, and TIM-3) was analyzed on pDCs (shown in dark turquoise), cDC1s (brown), cDC2s (orange), slanDCs (red). Each graph shows the overlay of the stained sample (colored) and the appropriate FMO control (shown in empty gray). A representative analysis is shown.

