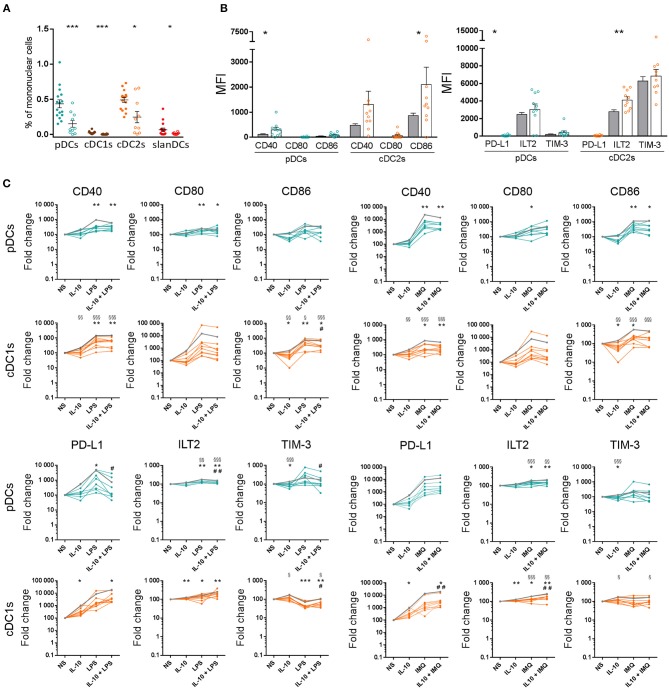
Figure 6.
Characterization of peripheral blood DC alterations in MDS patients. (A) The frequency of DC subsets in whole blood samples obtained from healthy donors (full circles, n = 16) and MDS patients (empty circles, n = 10), was expressed as percentage of mononuclear cells. (B) The expression levels of the costimulatory molecules CD40, CD80, CD86 and the inhibitory molecules PD-L1, ILT2, TIM-3 were assessed on pDCs and cDC2s of healthy donors (gray bars) and MDS patients (white bars behind colored empty circles) and expressed as net MFI. In each series, the mean ± SEM is also shown. *p < 0.05, **p < 0.01, ***p < 0.001 vs. healthy controls. Statistical significance calculated using the t-test. (C) Surface expression of costimulatory molecules and immune checkpoints on pDCs and cDC2s upon exposure to pro-inflammatory and anti-inflammatory stimuli in healthy controls (mean shown as gray line, n = 16) and MDS patients (colored lines, each line corresponding to one patient, n = 10). The expression of CD40, CD80, CD86, PD-L1, ILT2, and TIM-3 was assessed on DCs after 5-h incubation of whole blood samples in the absence or presence of LPS, IMQ, and IL-10 either alone or in combination. The expression level of each analyzed molecule was expressed as fold change of the net MFI normalized on untreated sample (Basal). §p < 0.05, §§p < 0.01, §§§p < 0.001 MDS vs. healthy controls. Statistical significance calculated using the t-test. *p < 0.05, **p < 0.01, ***p < 0.001 vs. MDS basal. #p < 0.05, ##p < 0.01 vs. MDS cells treated with TLR-ligand only. Statistical significance calculated using the paired t-test.

