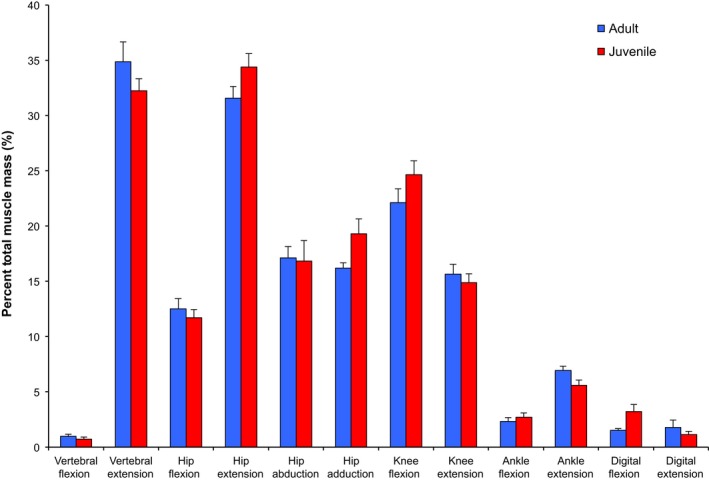
Figure 2.

Distribution of functional group muscle mass of rabbit muscles. Functional group masses were summed and averaged, and then normalized to total muscle mass. Proximal‐to‐distal muscle group mass is expressed as a percentage, with bars representing means for each functional group and age category (adult: n = 4; juvenile: n = 3). Error bars represent the standard deviation. Muscles with synergistic functions are combined in one functional group. Biarticular muscles and muscles with multiple actions are included in more than one functional group. In all data figures, blue indicates adults and red indicates juveniles.
