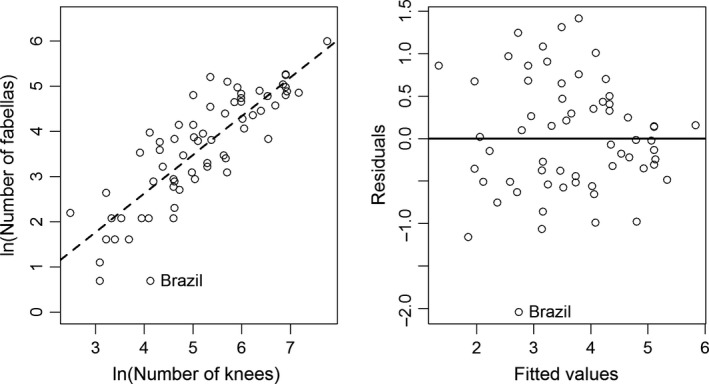
Figure 3.

Plot of the natural log of sample size (number of knees) and number of fabellas for the 57 studies considered for this analysis. A Pearson's correlation revealed a statistically significant relationship between the two variables (y = 0.82350 * x −0.60879; t‐value = 11.149, P = 2.96e‐16), with an intercept that is not statistically different from zero (t‐value = −1.541, P = 0.129). The data for Brazil (Silva et al., 2010) represent an outlier for this dataset.
