Figure 1.
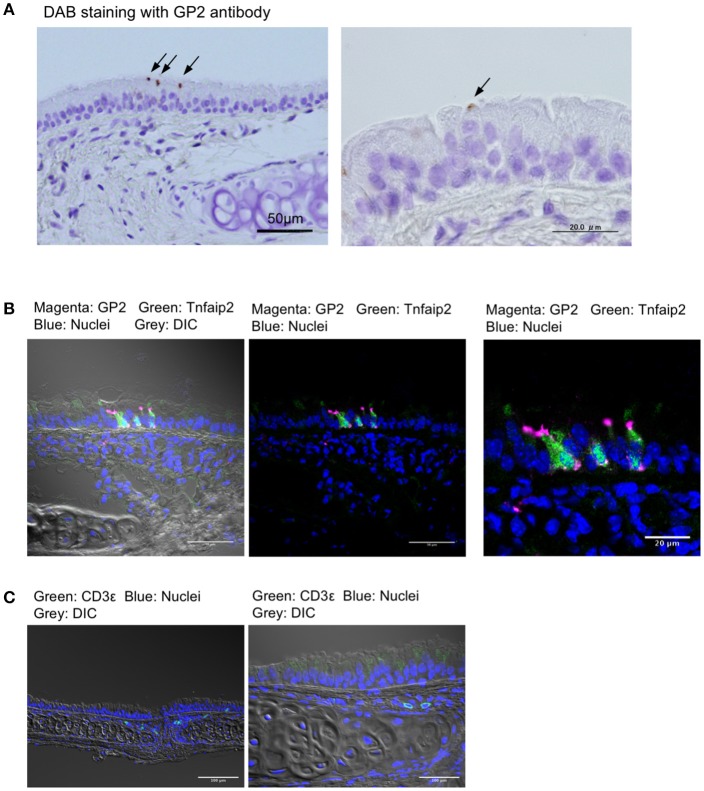
GP2+Tnfaip2+ cells in the tracheal epithelium. (A) Immunohistochemical images of GP2 in the trachea of BALB/c mice. Immunoreactivities of GP2 antibody are visualized with DAB chromogen with H2O2 (arrows), and tissues are counterstained with hematoxylin. Bars: 50 μm (left panel) and 20 μm (right panel). (B) Immunofluorescence images of Tnfaip2 (green) and GP2 (magenta) in the trachea of BALB/c mice. DIC (gray), differential interference contrast; Bars: 50 μm (left panel) and 20 μm (right panel). (C) Immunofluorescence images of CD3ε (green). Bars: 100 μm. Nuclei were stained with DAPI (blue) in (B,C).

