Figure 5.
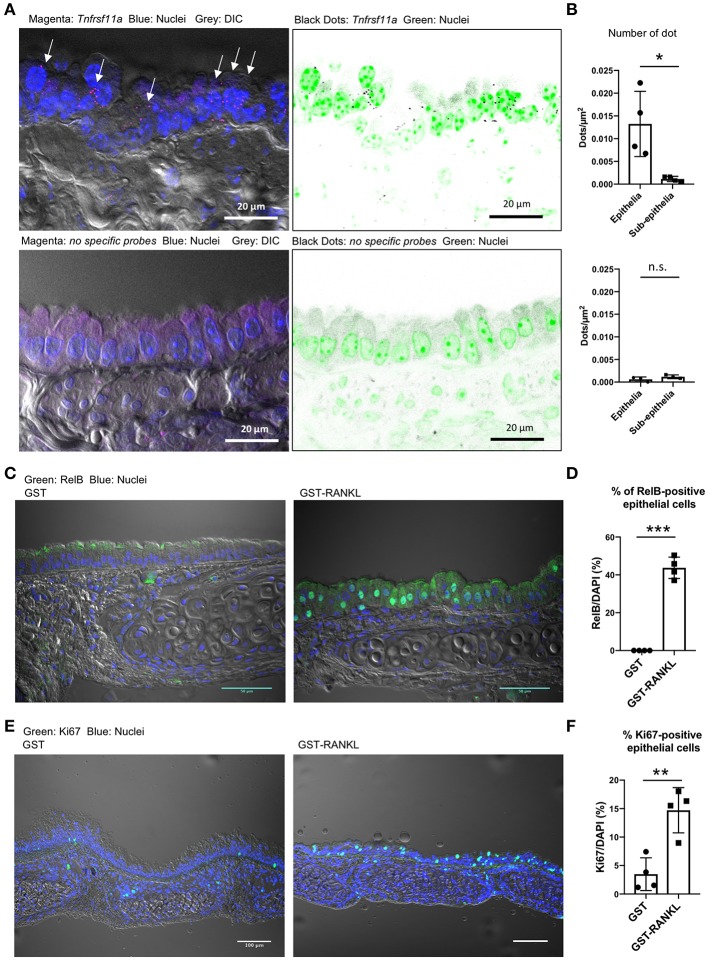
Receptor activator of NFκB (RANK) expression in the tracheal epithelium. (A) Fluorescence in situ hybridization (FISH) images of the tracheal epithelium of C57BL/6N mice using oligonucleotide probes for Tnfrsf11a encoding RANK (magenta dots in the left panels and black dots in the right panels). Arrows in the left panel indicate Tnfrsf11a-positive cells. Nuclei are colored with blue in the left panels and green in the right panels. Bars: 20 μm. (B) Quantification of FISH signals in the epithelial and subepithelial regions. Lower panels show FISH images using non-specific probes as a negative control. *P < 0.05, n.s., not significant calculated by Student's t-test. Data was obtained from 4 mice in each group from two independent experiments. The number of dots relative to the area of the epithelia or sub-epithelia (dots/μm2) was shown. Data expressed as mean ± standard deviation. (C,E) Administration of RANKL induces the accumulation of RelB (C: green) in the nuclei of the tracheal epithelium, and expands Ki67-positive cells (E: green) there. C57BL/6N mice were intraperitoneally injected with GST or GST–RANKL. After 24 h, mice were sacrificed and the trachea was extracted for immunofluorescence analysis. Representative immunofluorescence images of RelB are shown. Bars: 50 μm in (C) and 100 μm in (E). (D,F) Quantification of RelB-positive cells (D) and Ki67-positive cells (F). ***P < 0.005 and **P < 0.01, calculated with Student's t-test. Data were obtained from 4 mice in each group from 2 independent experiments in (D), and 4 mice in each group from 3 independent experiments in (F). Data expressed as mean ± standard deviation.

