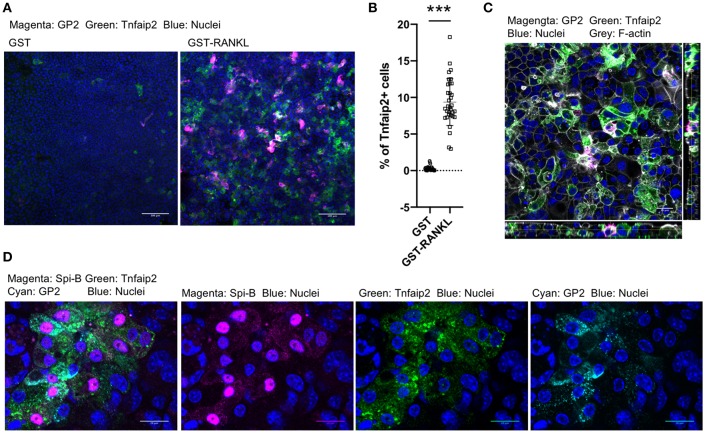
Figure 7.
RANKL induced GP2+Tnfaip2+ cells in the tracheal epithelial culture. (A) Harvested tracheal epithelial cells were cultured with 5 μg/mL GST or GST–RANKL for 6 days under ALI conditions. Immunofluorescence images of GP2 (magenta) and Tnfaip2 (green) are shown. Nuclei were stained with DAPI (blue). Bars: 100 μm. (B) Quantification of the area of Tnfaip2-positive cells. Data were obtained from 33 area in each group from 3 independent experiments and expressed as mean ± standard deviation. ***P < 0.005 calculated with Student's t-test; (C) Orthogonal images of Tnfaip2 (green), GP2 (magenta), F-actin (gray), and nuclei (blue) from confocal laser scanning microscopy. Bar: 20 μm. (D) Immunofluorescence images of Spi-B (magenta), Tnfaip2 (green), and GP2 (cyan). Nuclei were stained with DAPI (blue). Bars: 20 μm. Images are representative of at least three independent experiments.

