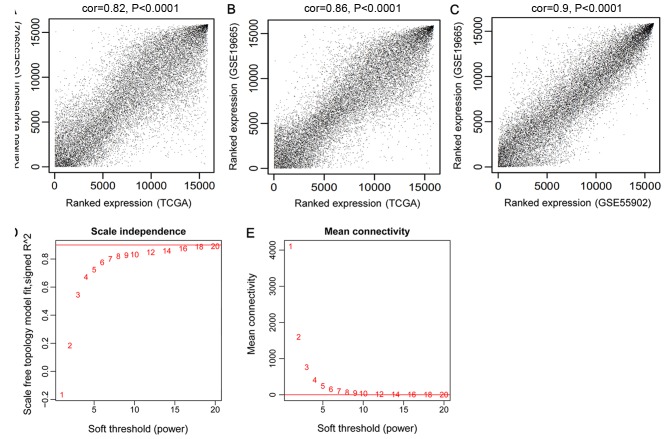
Figure 1.
Correlations between TCGA, GSE55092 and GSE19665, and the selection of the adjacency matrix weighting parameter β (power). (A) Correlation between the expression data of TCGA and GSE55092. (B) Correlation between the expression data of TCGA and GSE19665. (C) Correlation between the expression data of GSE55092 and GSE19665. (D) The selection diagram of the adjacency matrix weighting parameter ‘power’ (the red line indicates that the square of correlation coefficient was 0.9). (E) Mean connectivity of RNAs under various values of ‘power’ (the red line indicates that the mean connectivity degree of the RNAs in co-expression network was 8 when β=8). TCGA, The Cancer Genome Atlas.

