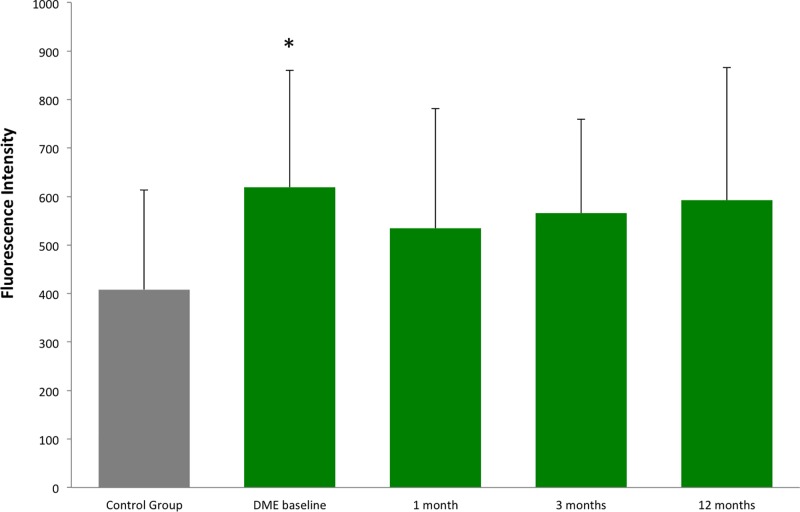
Figure 2. The figure shows AH concentrations of EPO in healthy subjects and in DME patients at baseline and 1, 3 and 12 months after SMPL treatment.
The results are expressed as fluorescent intensity signal mean value and standard deviation. The asterisk indicates a significant difference (P=0.029) compared to control group (healthy subjects). When comparing each time point of DME group after baseline to controls, at 3 months a borderline P-value (0.063) was found, while at 1 and 12 months, despite an increased mean value, the significance was not detected. Note that in DME group, no differences were found at 1, 3 and 12 months compared with baseline value.

