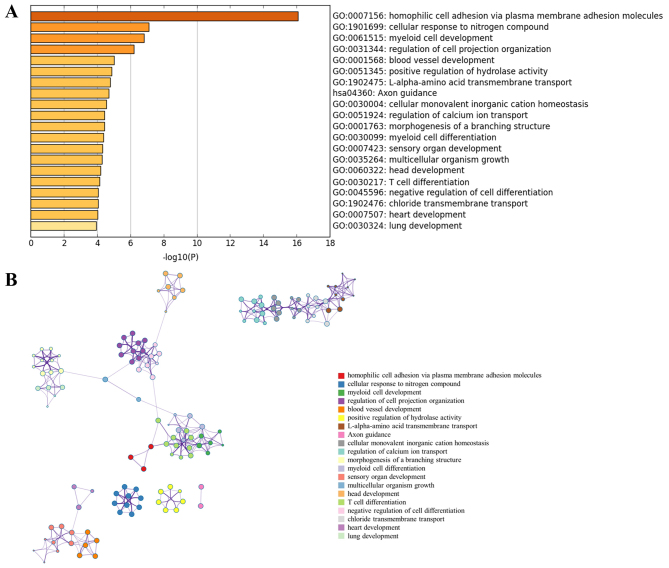
Figure 2.
Functional enrichment analysis of miRNA-target genes. (A) Top 20 clusters from Metascape pathway enrichment analysis of differentially expressed-miRNAs-associated genes. (B) Associations between these top 20 clusters enrichment terms displayed as a network analyzed by Metascape. Nodes of the same color belong to the same cluster. Terms with a similarity score >0.3 are linked by an edge. The network was visualized with Cytoscape with ‘force-directed’ layout and edge bundled for clarity. miRNA, microRNA.

