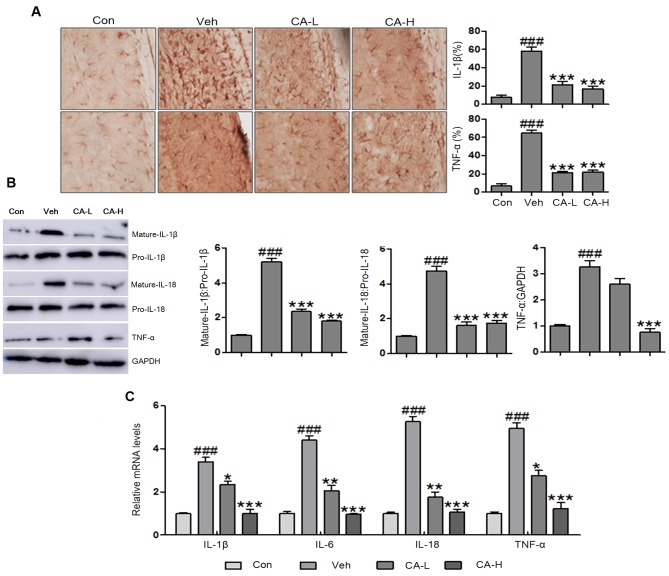
Figure 3.
Effects of CA on the secretion of pro-inflammatory cytokines in the brain of HFD mice. (A) Immunohistochemical analysis of IL-1β and TNF-α in brain tissues of HFD mice (magnification, ×50). (B) Protein expression levels of IL-1β, IL-18 and TNF-α in HFD mice, as assessed by western blot analysis. (C) mRNA expression levels of pro-inflammatory cytokines in the brain of HFD mice, as assessed by reverse transcription-quantitative PCR analysis. Data are expressed as the means ± SEM. n=10 in each group. ###P<0.001 vs. Con; *P<0.05, **P<0.01 and ***P<0.001 vs. Veh. CA, carnosic acid; CA-H, HFD mice treated with 20 mg/kg CA; CA-L, HFD mice treated with 10 mg/kg CA; Con, Control group; HFD, high-fat diet; IL, interleukin; TNF-α, tumor necrosis factor-α; Veh, HFD mice.

