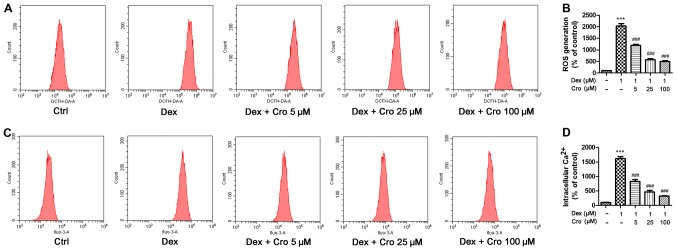
Figure 3.
Effects of Cro on ROS and intracellular Ca2+ levels in Dex-treated MC3T3-E1 osteoblasts. Cells were pretreated with Cro (5, 25 and 100 µM) for 1 h and were then treated with 1 µM Dex for 24 h. (A) ROS levels, as determined by flow cytometry. (B) Quantitative analysis of ROS. (C) Intracellular Ca2+ levels, as determined by flow cytometry. (D) Quantitative analysis of intracellular Ca2+ levels. Data are presented as the means ± standard deviation of three independent experiments. ***P<0.001 vs. Ctrl; ###P<0.001 vs. Dex. Cro, crocin; DCFH-DA, dichlorodihydrofluorescein diacetate; Dex, dexamethasone; ROS, reactive oxygen species.

