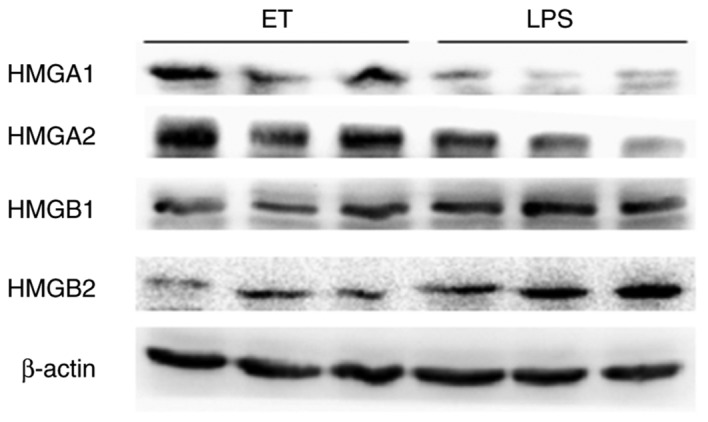
Figure 8.

Validation of HMGA1, HMGA2, HMGB1 and HMGB2 by western blot analysis. The expression of HMGA1 and HMGA2 in the ET group was higher compared with the LPS group at 4 h after high-dose LPS stimulation), while HMGB1 and HMGB2 exhibited the opposite expression trend under the same conditions. LPS, lipopolysaccharide; ET, endotoxin tolerance; HMG, high mobility group.
