Figure 1.
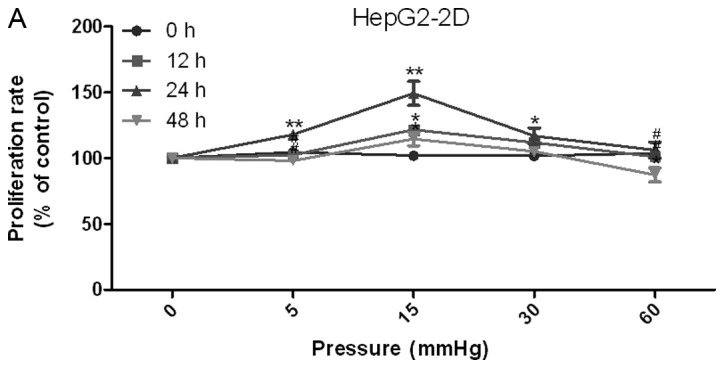
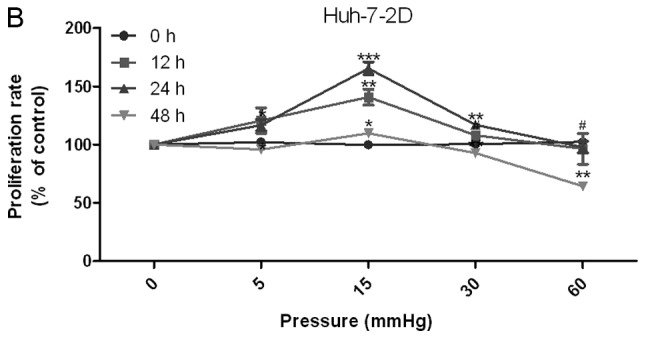
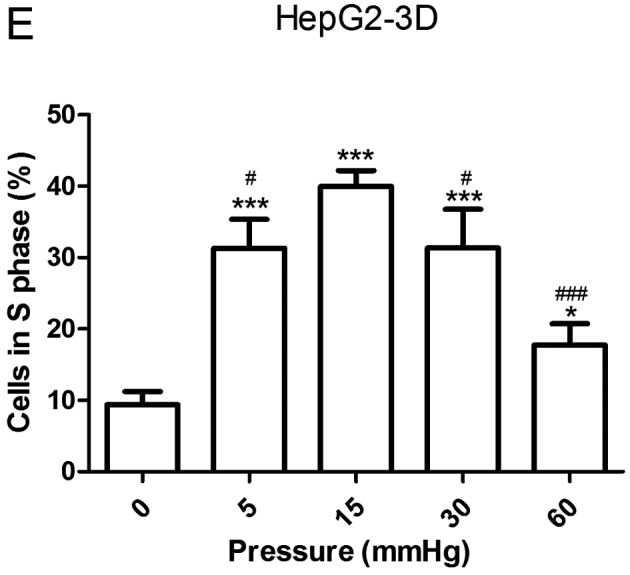
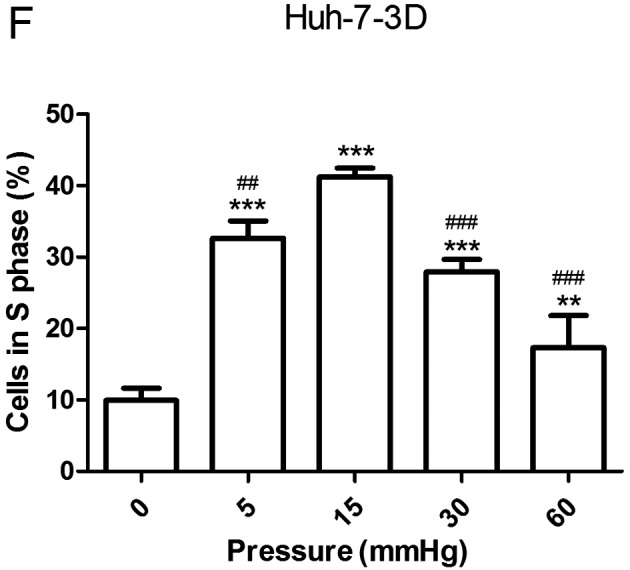
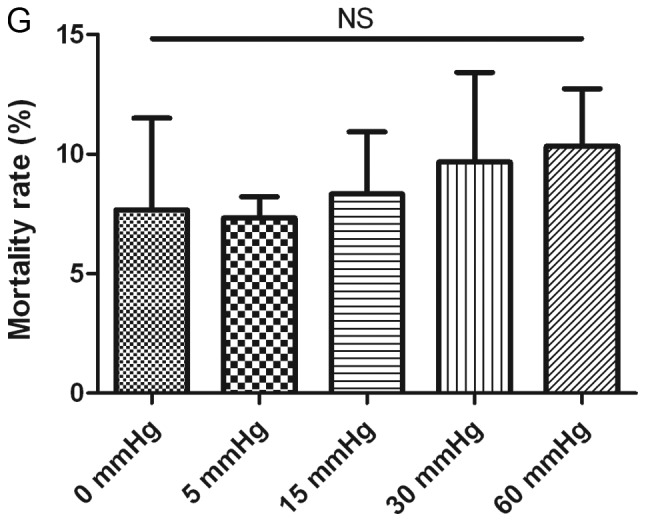
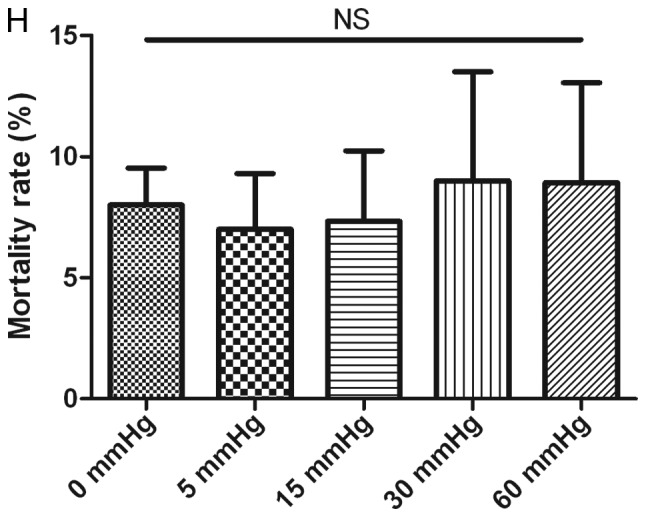
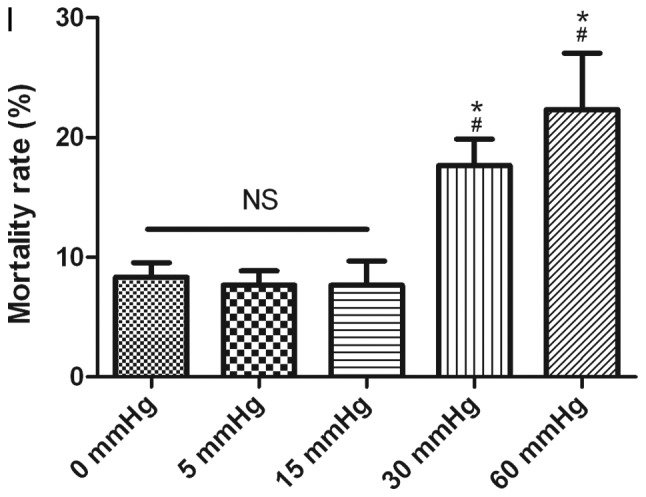
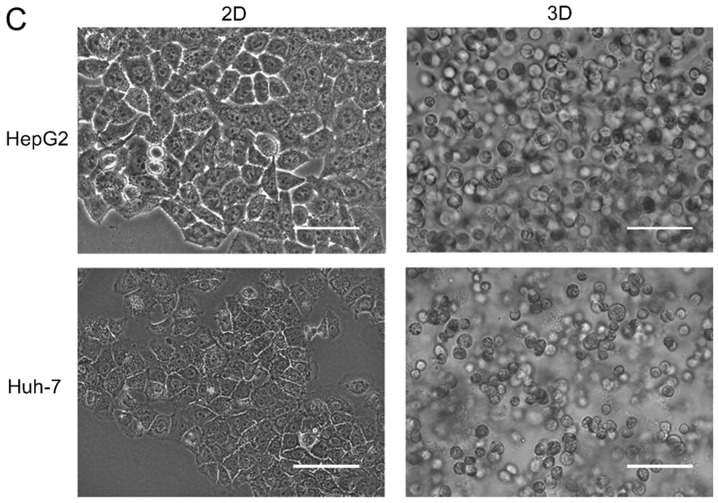
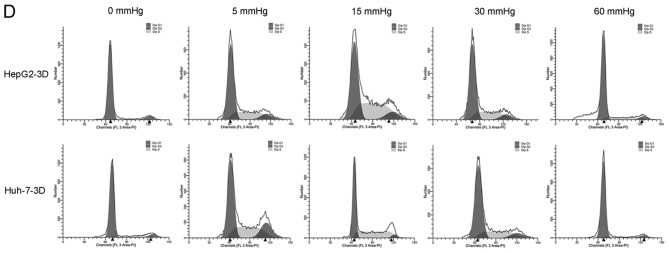
Effects of elevated pressure on the proliferation of HepG2 and Huh-7 liver cancer cells in vitro. 2D-cultured (A) HepG2 and (B) Huh-7 liver cancer cells were cultivated under pressure (0, 5, 15, 30 and 60 mmHg) and observed at different time points (0, 12, 24 and 48 h); their proliferation (relative to the control group) was assessed using the Cell Counting kit-8 assay. (C) Morphology of 2D-cultured and 3D-cultured liver cancer cell lines (magnification, ×400). Uneven illumination was corrected using a control image. Scale bar=50 µm. (D) Flow cytometry results of 3D-cultured cells under pressure for 24 h; the ratio of (E) HepG2 and (F) Huh-7 cells in the S phase of the cell cycle was evaluated using a cell cycle assay. Effects of elevated pressure on the proliferation of HepG2 and Huh-7 liver cancer cells in vitro. Mortality rate for HepG2 pressurized at 15 mmHg for (G) 12, (H) 24 and (I) 48 h. All data are expressed as the means ± standard deviation. The data were analyzed using ANOVA, followed by the least significant difference post hoc test. *P<0.05, **P<0.01 and ***P<0.001 vs. 0 mmHg. #P<0.05, ##P<0.01 and ###P<0.001 vs. 15 mmHg. 2D, 2-dimensional; 3D, 3-dimensional; NS, not significant.

