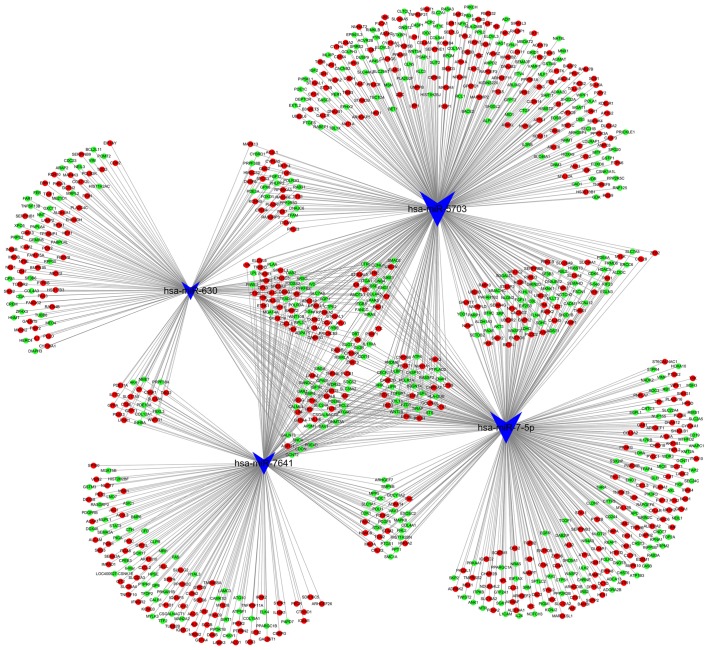
Figure 4.
miRNA-gene network. According to the interactions between miRNAs and the 1,309 integrated target genes, a miRNA-gene network was generated. The blue arrowheads represent differentially expressed miRNAs; the red circles represent upregulated mRNAs; and the green circles represent downregulated mRNAs. miRNA, microRNA.

