Figure 8.
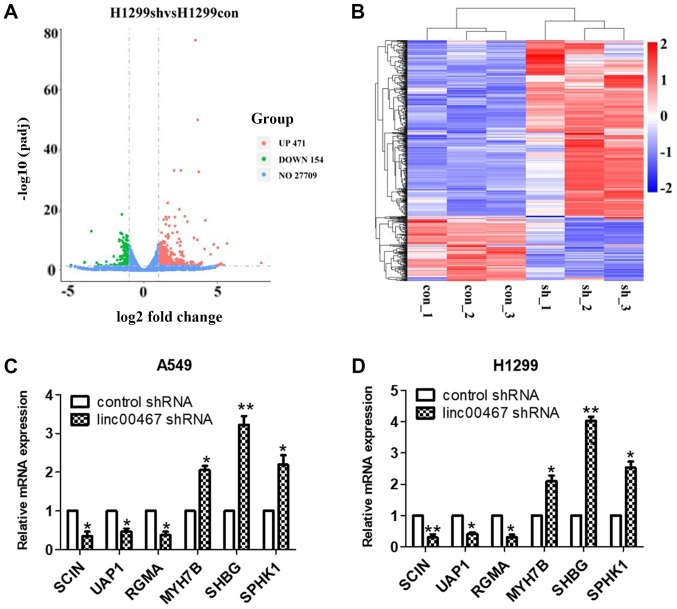
Gene expression profiling. (A and B) RNA transcriptome sequencing was used to analyse the gene expression profile in H1299 cells following linc00467 knockdown. A total of 625 differentially expressed transcripts were identified (471 upregulated transcripts and 154 downregulated transcripts, |log2 (fold change)|> 1 and P<0.05). A volcano plot and heat-map present all of the differentially expressed genes between linc00467-knockdown H1299 and control cells. (C and D) Reverse transcription quantitative polymerase chain reaction was used to verify the mRNA expression levels of 6 randomly selected genes in control shRNA vs. linc00467 shRNA-transfected (C) A549 and (D) H1299 cells. *P<0.05 and **P<0.01. linc, long intergenic non-coding RNA; shRNA, short hairpin RNA.

