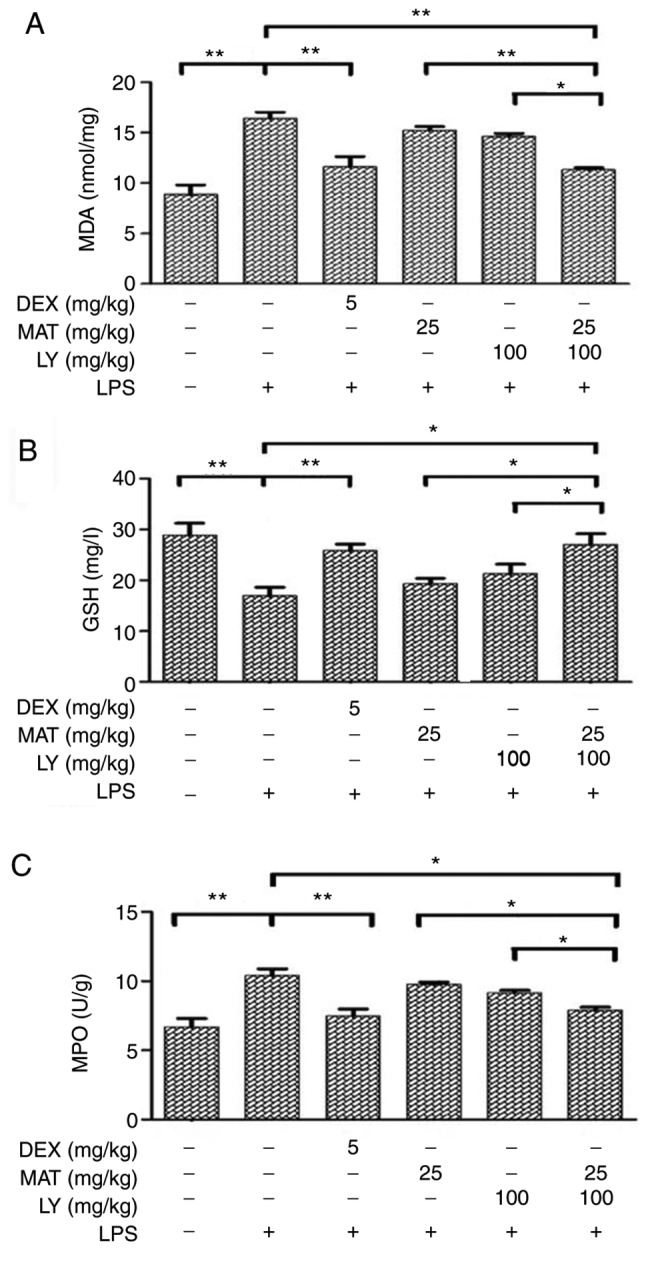
Figure 3.

Levels of oxidative stress biomarkers in lung tissues. Lung tissues were collected and homogenized. Levels of (A) MDA, (B) GSH and (C) MPO were determined using respective kits. Data are presented as the mean ± standard deviation. n=6. *P<0.05, **P<0.01. MDA, malondialdehyde; DEX, dexamethasone; MAT, matrine; LY, lycopene; LPS, lipopolysaccharide; GSH, glutathione; MPO, myeloperoxidase.
