
Figure 2.
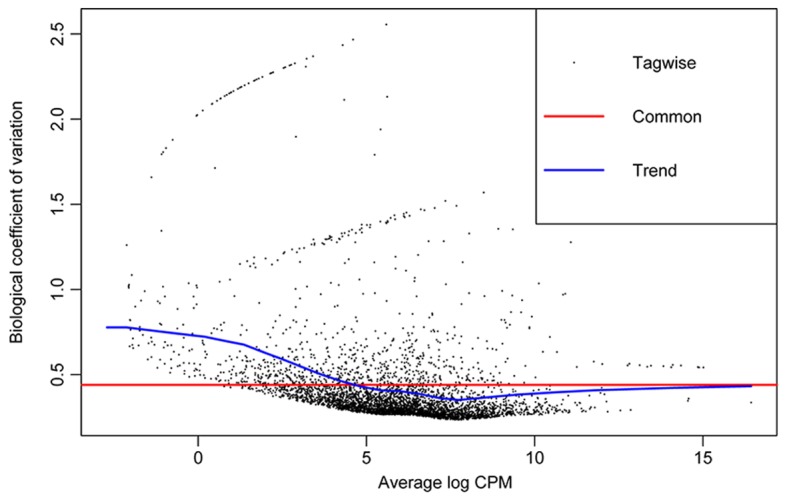
Dispersion plots. plotBCV illustrates the relationship of the biological coefficient of variation with the mean log counts per million.
Official websites use .gov
A
.gov website belongs to an official
government organization in the United States.
Secure .gov websites use HTTPS
A lock (
) or https:// means you've safely
connected to the .gov website. Share sensitive
information only on official, secure websites.
Dispersion plots. plotBCV illustrates the relationship of the biological coefficient of variation with the mean log counts per million.