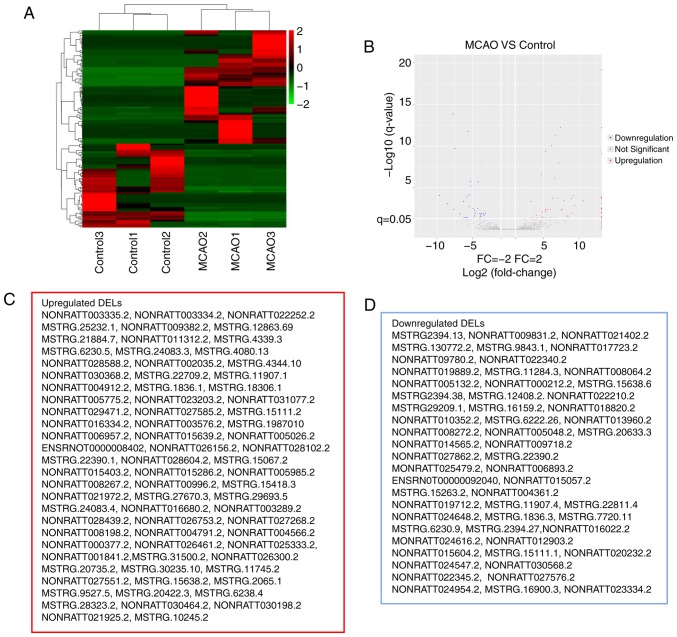
Figure 2.
RNA-seq data on the differentially expressed lncRNAs between the model and control groups. (A) Hierarchical cluster of DELs between the MCAO and control groups. The color code in each heat map is linear, with green indicating the least and red indicating the greatest differentiation. The mean signals of the altered lncRNAs in each of the two groups were clustered using a Euclidean distance function. The lncRNAs with the most similar expression patterns were placed next to each other (n=3 per group). (B) A volcano plot of the RNA-seq FC and P-value of MCAO group compared with the control group. Blue and red points stand for DELs. Gray points represent lncRNAs which are not differentially expressed. (C) Upregulated and (D) downregulated DELs as exhibited in the red and blue boxes, respectively, represent the results. MCAO, Middle cerebral artery occlusion; lncRNA, long noncoding RNA; RNA-seq, RNA sequencing; FC, fold change; DEL, differentially expressed lncRNAs.

