Fig. 5.

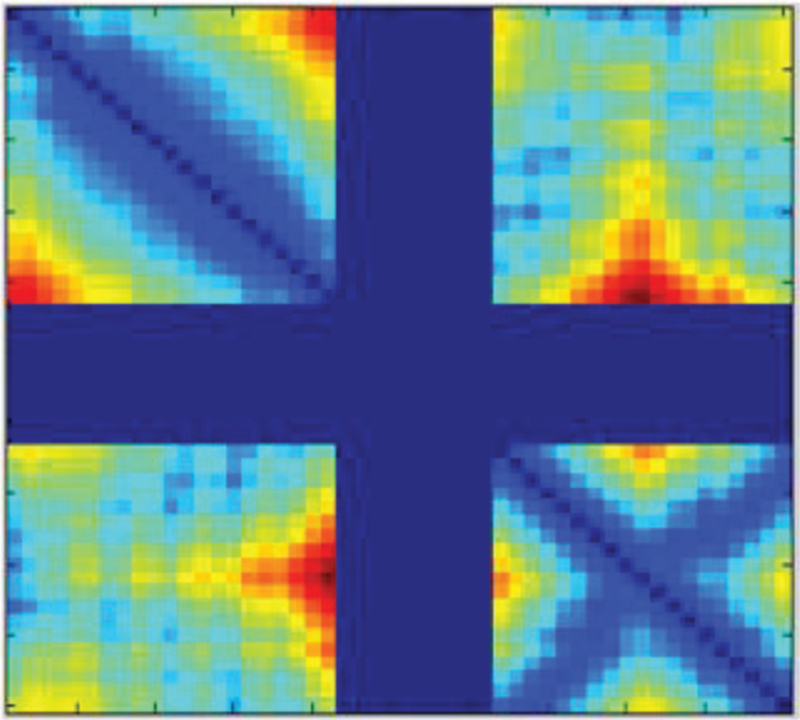
An example of the distance matrix of a protein structure containing a gap region in the middle (the blue bands), the Con-Looper method is used to predict the gap region’s 3-D structure.

An example of the distance matrix of a protein structure containing a gap region in the middle (the blue bands), the Con-Looper method is used to predict the gap region’s 3-D structure.