
Figure 3.
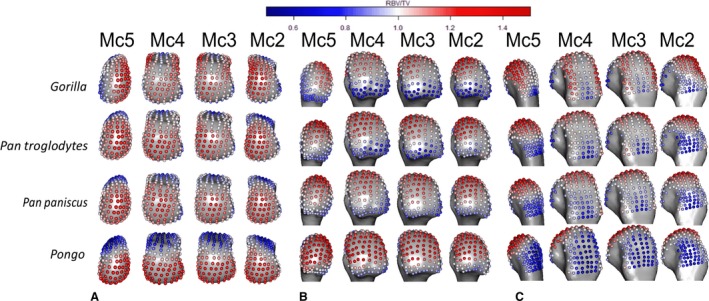
Species average RBV/TV, mapped to average models of each Mc head in (A) distal, (B) palmar and (C) dorsal views. RBV/TV values around one (white) indicate landmarks close to the average BV/TV of that Mc head, while values above (red) or below one (blue) indicate a deviation from this average at these landmarks.