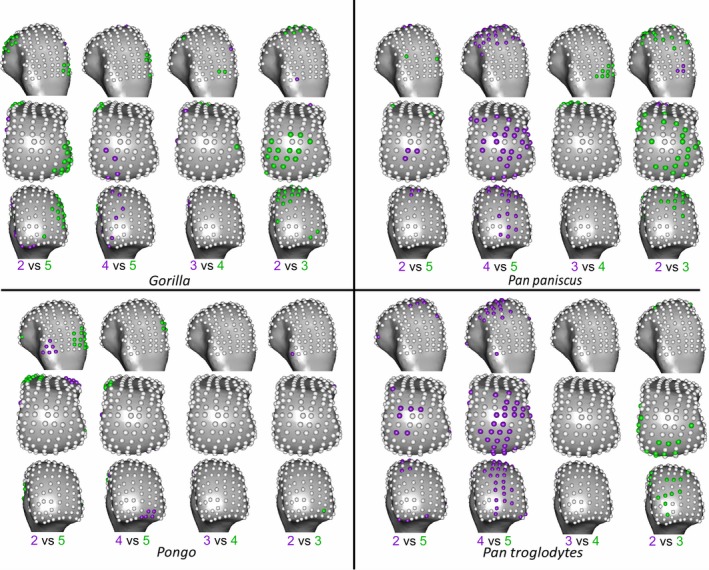
Figure 6.

Inter‐ray significant differences in DA, mapped to an average right Mc3 head in each case in dorsal (top), distal (middle) and palmar (bottom) views. Where DA values at landmarks are significantly higher in one ray than the other, they are coloured as per the ray numbers in each comparison.
