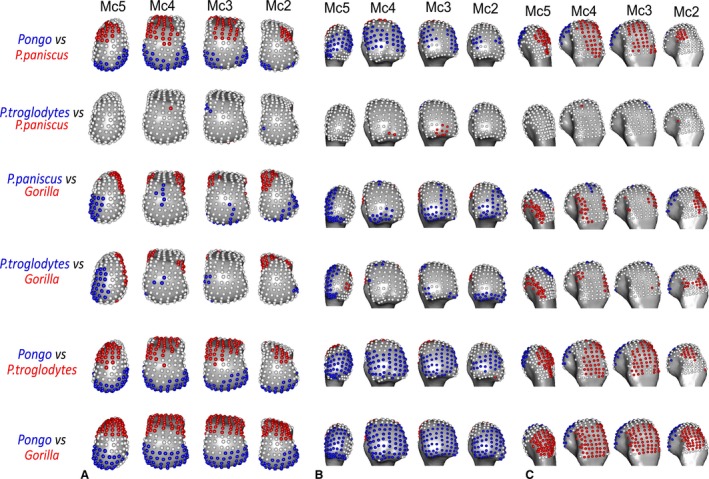
Figure 7.

Significant differences in RBV/TV between species, mapped to average models of each Mc head in (A) distal, (B) palmar and (C) dorsal views. Where RBV/TV values at landmarks are significantly higher in one species than the other, they are coloured as per the species in each comparison.
