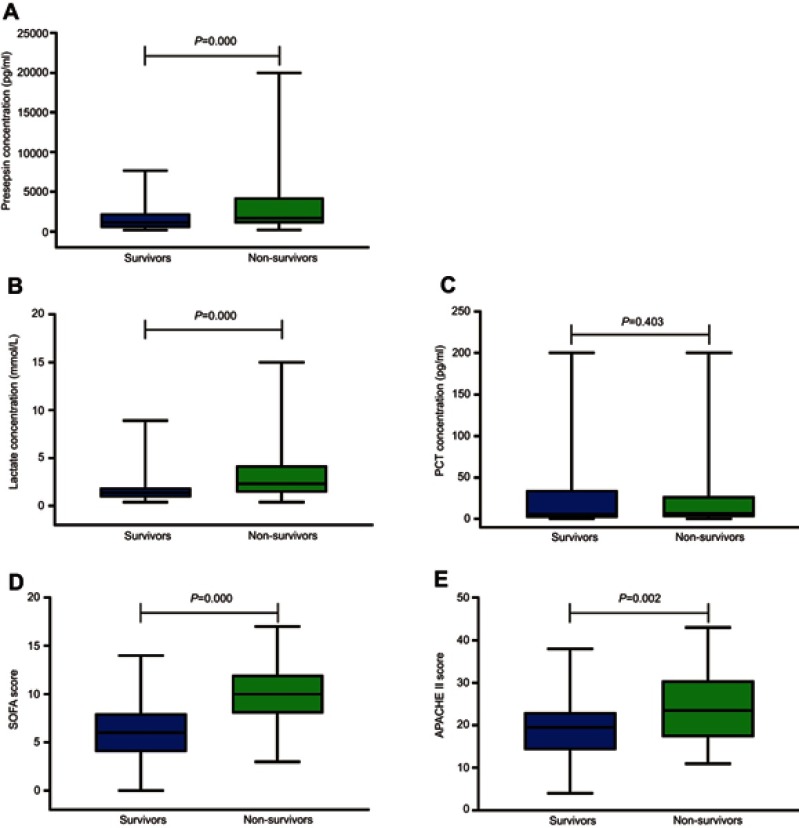
Figure 1.
The SOFA score, APACHE II score, and the levels of presepsin, PCT and lactate upon admission in the survivor and non-survivor groups. (A and B) The levels of presepsin and lactate in the non-survivor group are significantly higher than those of the survivor group (presepsin: P=0.000; lactate: P=0.000). (C) There is no significant difference in the PCT level between the two groups (P=0.403). (D and E) The SOFA score and APACHE II score of the non-survivor group are significantly higher than those of the survivor group (SOFA score: P=0.000; APACHE II score: P=0.002).
Abbreviations: SOFA score, Sequential Organ Failure Assessment score; APACHE II score, Acute Physiology and Chronic Health Evaluation II score; PCT, procalcitonin.

