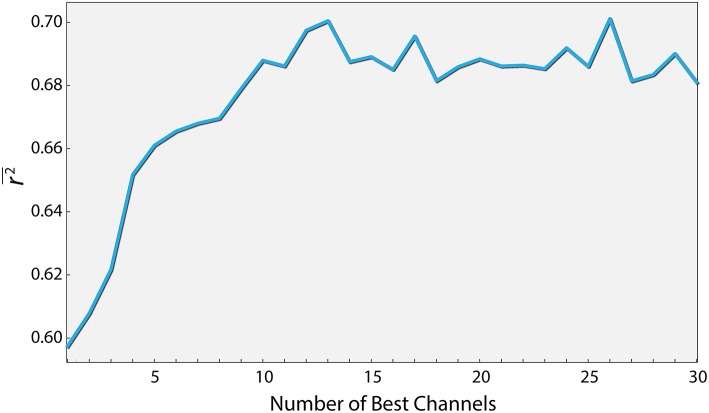
Figure 4.
Performance as a function of the number of best channels. Channels were ordered according to their contribution to the prediction quality (see text for details). The curve depicts the prediction quality (r2) for the XGBoost algorithm as a function of the number of best channels taken into account.

