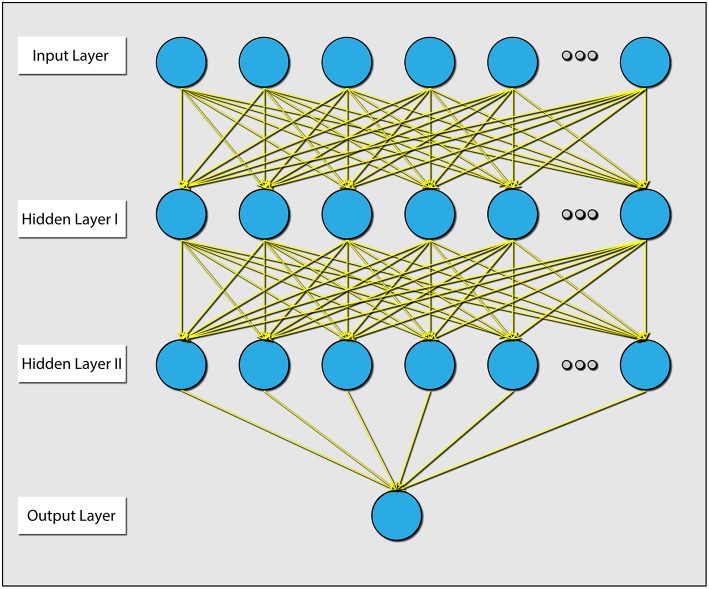
Figure 6.
Diagram explaining the architecture of the ANN that was used. There were 2 hidden layers, and all layers were dense (e.g., all connections were present). The parameters between the input layer and hidden layer 1, and the parameters between hidden layer 1 and hidden layer 2 were held during the individualization phase.

