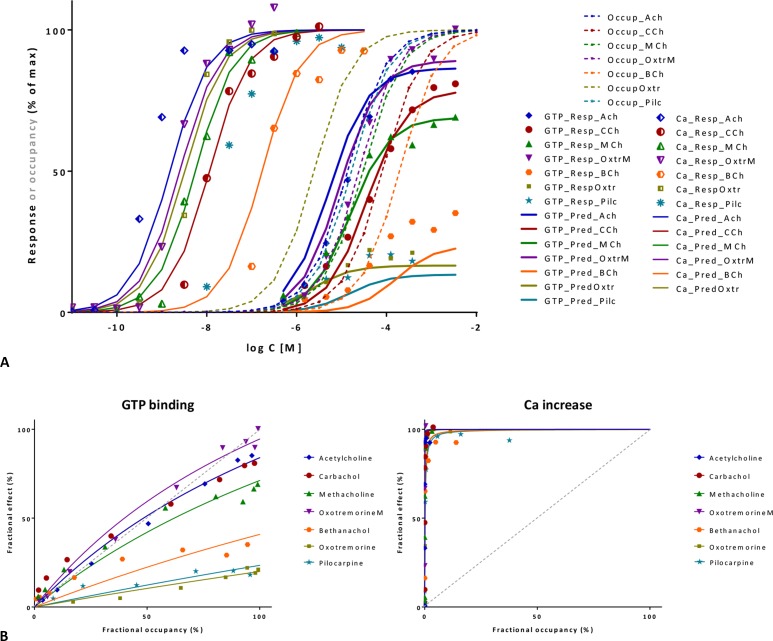
Figure 10.
Fit of complex concentration-response data with the present model, Case II: Activity and binding data for a series of muscarinic agonists (data after Sykes et al., 2009). Responses were measured at two different points after M3 receptor activation: stimulation of GTP binding to Gα subunits and subsequent increase in intracellular Ca levels, respectively. (A) Fractional GTP and Ca responses (closed and semi-open symbols, respectively) as a function of log concentration for seven compounds fitted by the present model using independently derived K d values for binding affinity (Sykes et al., 2009) (Equation 4; thicker and thinner lines, respectively). Fitting of the response data is done by adjusting only two common γ (gain) and seven individual ε (efficacy) parameters (Table S2). Fractional receptor occupancy data [calculated from the K d determined for the receptor binding by competition assays (Sykes et al., 2009)] are also shown as dashed lines to highlight the ability of the model to account for the ligand-dependent mismatch between the two different fractional responses and occupancy. (B) Fractional response vs. occupancy data in the GTP (left) and Ca (right) assays for these seven compounds (symbols) and their corresponding fit with the present model fitted directly via Equation 27. The very different amplification of these two responses assessed here at two different vantage points along the pathway is quite evident from these graphs.

