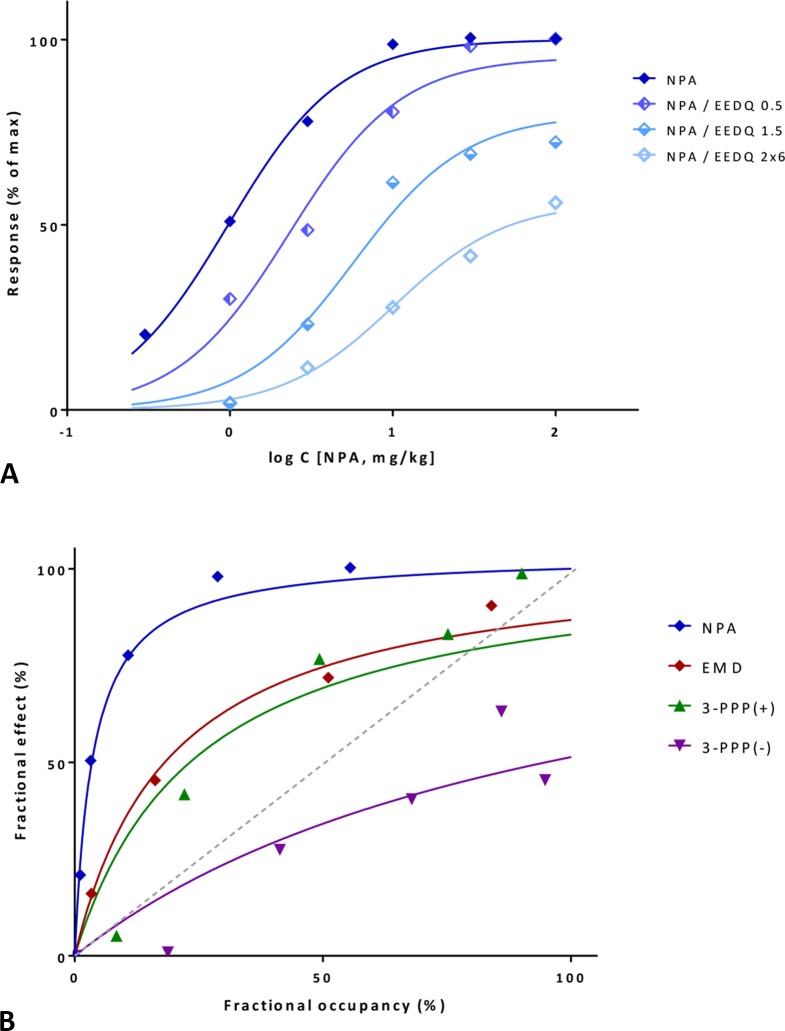
Figure 11.
Fit of complex concentration-response data with the present model, Case III: Activity and binding data for the dopamine agonist reversal of γ-butyrolactone-induced striatal L-DOPA accumulation in rats (after Meller et al., 1987). (A) Percent of maximal response for N-propylnorapomorphine (NPA) and following inhibition by increasing doses of the irreversible antagonist EEDQ (0.5, 1.5, and 2×6 mg/kg). Experimental data (symbols) were fitted with the present model (lines) using Equation 33 with a single K d and γ parameter and different ε values to account for the effect of inactivation via q. (B) Fractional response vs. occupancy data obtained in the same system (without inhibition) for four different compounds (NPA, EMD 23,448, (+)3-PPP, and (–)3-PPP). Occupancy data as calculated from K d estimates in Meller et al. (1987). Data (symbols) were fitted with the present model (lines) using Equation 22 with a single γ parameter. Note that the gain parameters obtained from the same signaling pathway, but with different data sets derived from different methods are in good agreement (Table S3).

