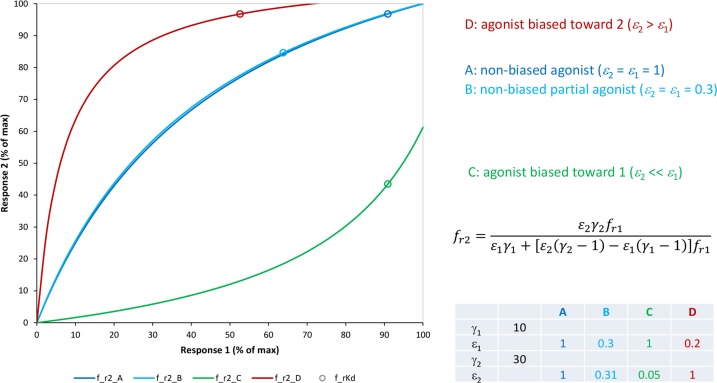
Figure 13.
Simulated relative response (“bias”) plots with the present model (Equation 38) for two pathways with different amplifications (γ 1=10 and γ 2=30) and for agonists A–D with efficacies ε 1 and ε 2 as indicated. Small circles along the lines indicate the responses corresponding to 50% occupancy (i.e., at ligand concentrations of K d) to illustrate the mismatch between fractional responses and fractional occupancies along each pathway.

