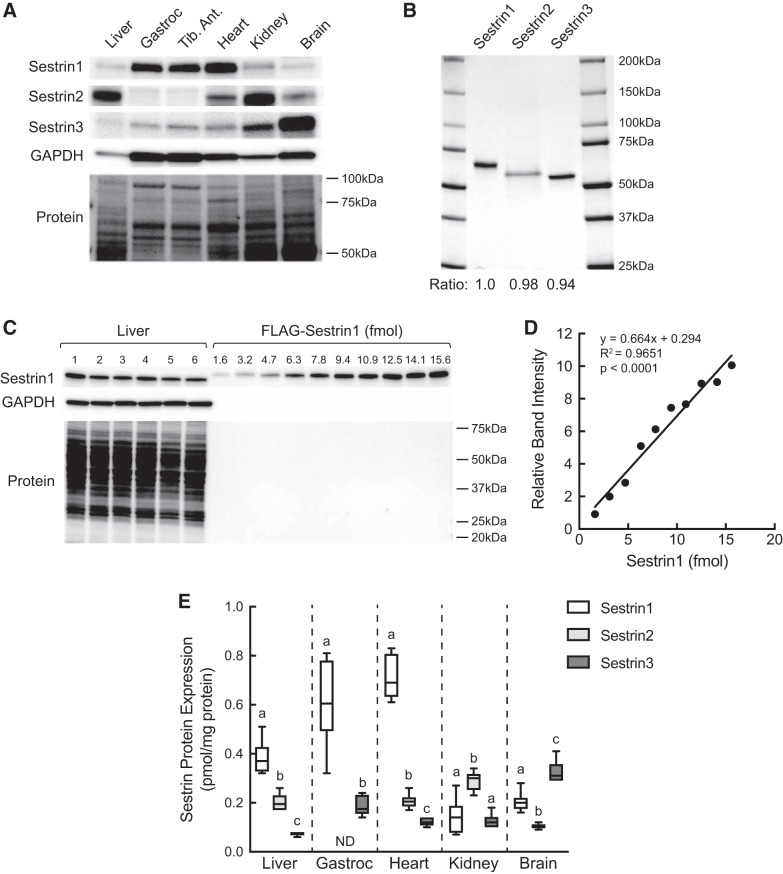
Fig. 3.
Western blot analysis of Sestrin1, 2, and 3 protein expression in liver, gastrocnemius, tibialis anterior, heart, kidney, and brain. A: representative Western blot analysis of Sestrin and GAPDH expression. Membranes were stained with Pierce Reversible Stain for PVDF and then destained before Western blot analysis; a representative membrane is shown. Sestrin1, 2, and 3 antibodies were validated using HEK293T cells lacking all three Sestrin proteins [kindly provided by Dr. David Sabatini (21)]. B: FLAG-tagged Sestrin1, 2, and 3 were individually expressed in and purified from HEK293T cells as described under materials and methods. Purified proteins (2 µg) were resolved by SDS-PAGE, and the gel was stained with SimplyBlue SafeStain. Ratio, band intensity relative to Sestrin1. C: Western blot analysis of Sestrin1 and GAPDH expression in liver (n = 6) and various amounts of purified FLAG-Sestrin1. Membranes were stained for total protein loading before Western blot analysis as described above for A. D: representative standard curve for FLAG-Sestrin1. E: quantification of Western blot analysis of Sestrin1, 2, and 3 expression in various tissues. Values represent means ± SE (n = 6). Method used to quantify Sestrin1 shown in C and D was also used to quantify Sestrins 2 and 3 using the respective purified proteins (B). ND, Sestrin2 expression in gastrocnemius was too low to be accurately quantitated, and therefore is not included on the graph. For each tissue except gastrocnemius, values not sharing the same letter are significantly different by one-way ANOVA, P < 0.001. For gastrocnemius, P < 0.0005 by t-test. Gastroc, gastrocnemius; Tib. Ant., tibialis anterior.

