
Fig. 3.
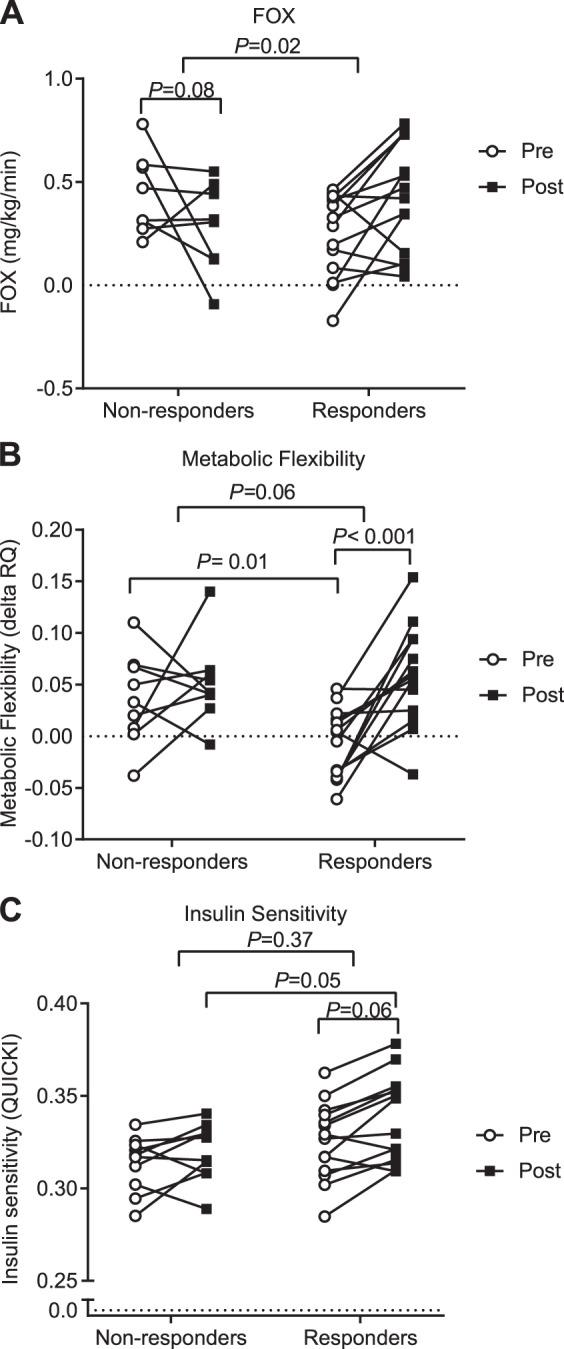
Individual responses are shown for both nonresponder and responder groups. Data were analyzed by two-way ANOVA. Raw values are plotted; the P value shown is the result of a repeated-measures linear model after adjusting for fat mass in a linear regression model to estimate group differences in nonresponders vs. responders. After adjusting for fat mass in a linear regression model, FOX is tending to decrease in the nonresponder group, P = 0.08 (A). Nonresponders had a greater metabolic flexibility at baseline, P = 0.01, whereas the responder group had a more significant increase in metabolic flexibility with exercise training, P < 0.001 (B). For insulin sensitivity, after adjusting for fat mass, there was no change in group differences, but responders had a higher insulin sensitivity postintervention, P = 0.05, and tended to have increased insulin sensitivity postintervention, P = 0.06 (C). P ≤ 0.05 is considered significant. FOX, whole body fat oxidation rate; Post, after exercise intervention; Pre, before exercise intervention; QUICKI, insulin sensitivity index; RQ, respiratory quotient.