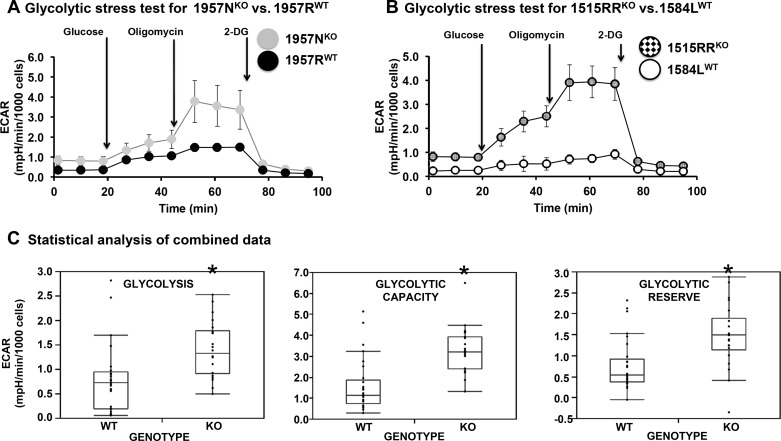
Fig. 6.
Loss of nuclear matrix protein 4 (Nmp4) enhances glycolytic capacity. The line graphs show a comparison of wild-type (WT) versus Nmp4−/− mesenchymal stem/progenitor cells (MSPC) extracellular acidification rate (ECAR) profiles that have undergone the glycolytic stress test. A: The MSPCs 1957RWT and 1957NKO were derived from male littermates. B: the MSPCs 1584LWT and 1515RRKO were derived from a random pair of male WT and Nmp4−/− mice. These graphs are representative of 4 individual tissue culture experiments (biological replicates). C: these graphs represent data from 5 separate experiments with cells from 5 different platings. In each experiment, 10 technical replicates with each cell preparation have been performed. The data are means ± SD. *P < 0.05, statistical significance. Glycolysis is the increase in ECAR measured after the glucose injection. This is the rate of glycolysis under basal conditions. Glycolytic capacity is the increase in ECAR after oligomycin injection. Glycolytic reserve is determined after 2-deoxy-d-glucose (2-DG) injection, which inhibits glycolysis. The difference between glycolytic capacity and glycolysis rates defines glycolytic reserve.

