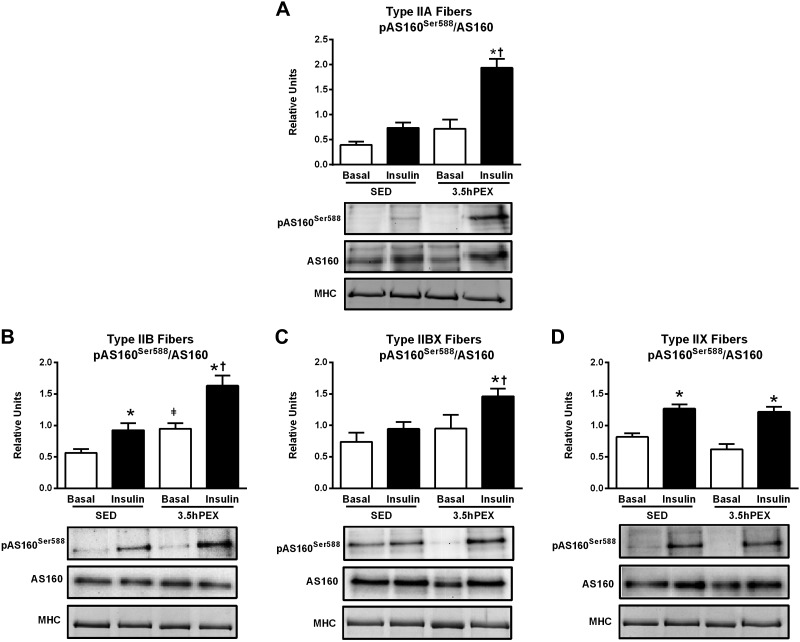
Fig. 7.
A–D: effects of insulin and exercise on pAS160Ser588/AS160 in IIA (A), IIB (B), IIBX (C), and IIX (D) fibers from 3.5 h postexercise (3.5hPEX) and time-matched sedentary (SED) rats, incubated without or with a submaximally effective insulin dose. Open bar: no insulin from SED or 3.5hPEX group; filled bar: with insulin from SED or 3.5hPEX group. There was insufficient signal to quantify pAS160Ser588/AS160 in type I fibers (not shown). *Insulin versus basal (no insulin): P < 0.001 in type IIB and IIX fibers (SED group); and type IIA, P < 0.001; IIB, P < 0.001; IIBX, P < 0.05; IIX, P < 0.001 (3.5hPEX group). ‡3.5hPEX versus SED with basal (no insulin): P < 0.05 in IIB fibers. †3.5hPEX versus SED with insulin: type IIA fibers, P < 0.001; IIB, P < 0.05; IIBX, P < 0.05. Data were analyzed by two-way ANOVA, and Tukey post hoc analysis was performed to identify the source of significant variance. Values are means ± SE; n = 3–6 per group. Representative blots and loading controls [myosin heavy chain (MHC)]) are included for each fiber type.

