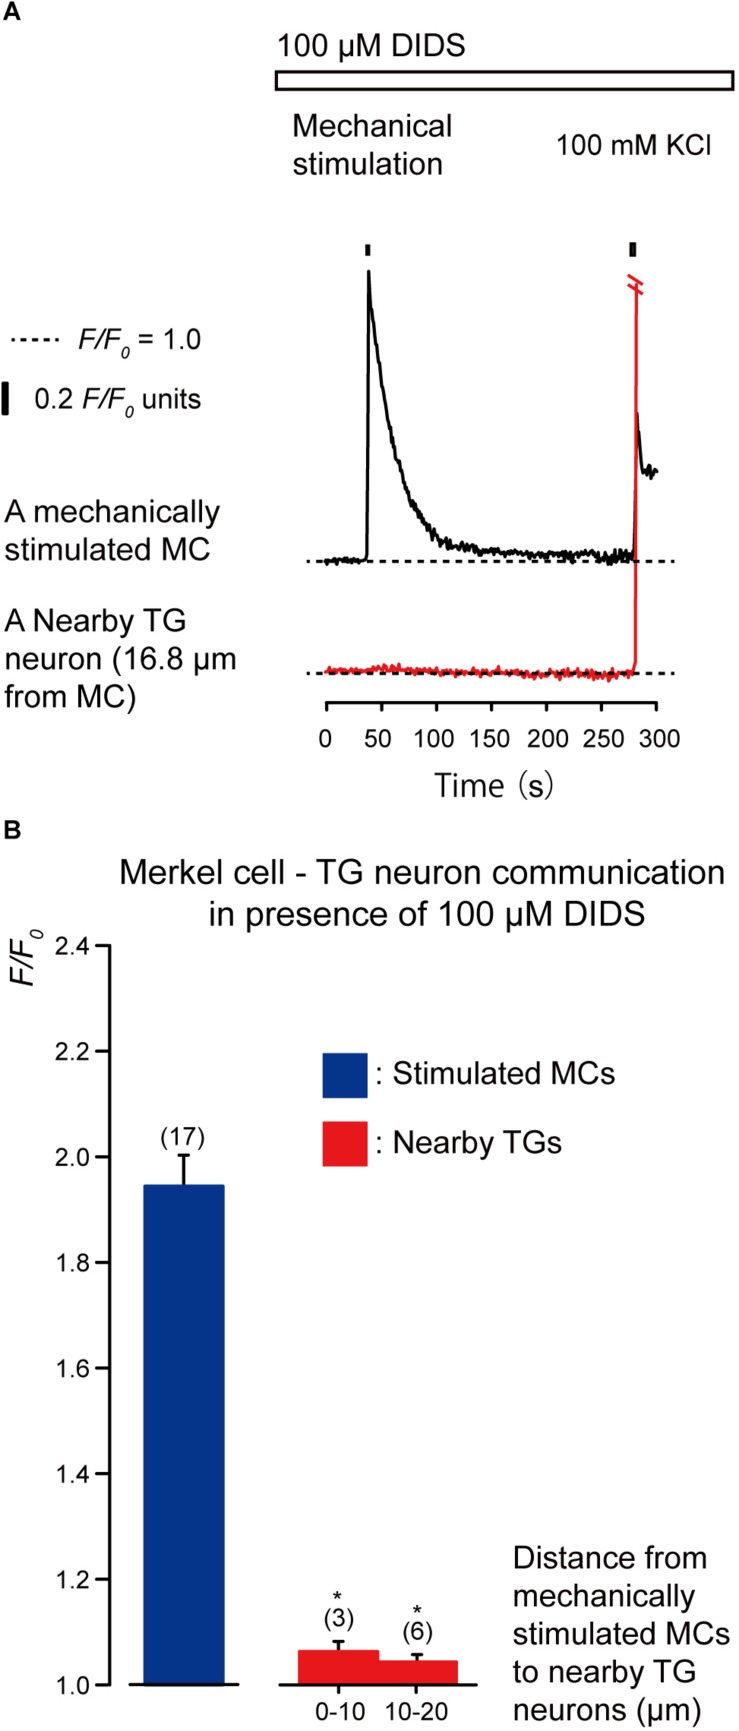
FIGURE 6.
Effect of DIDS on the increases in [Ca2+]i in stimulated MCs and nearby TGs during the mechanical stimulation of a single MC. (A) Traces of [Ca2+]i increases in the stimulated MC (black trace) and its nearby TGs (red trace) in the presence of 100 μM DIDS (upper white box). Responses from the nearby TGs were recorded in cells at 16.8 μm from the stimulated MCs. The construction of the horizontal dotted lines, upper filled boxes and [Ca2+]i increases by application of high concentration of extracellular 100 mM K+ solution are the same as in Figure 4. (B) The F/F0 values of the mechanically stimulated MCs (blue column) and nearby TGs (red columns) located within 0–10.0 μm and 10.1–20.0 μm of the mechanically stimulated MCs in the (presence of 100 μM DIDS. Bars represent the mean ± SE. The numbers in parentheses indicate the tested cells. We could not observe any statistically significant differences between the F/F0 values of the mechanically stimulated MCs in the absence (Figure 3B) and presence of 100 μM DIDS (P > 0.05). Statistically significant differences between the F/F0 values of TGs located at 0–10.0 μm and 10.1–20.0 μm from mechanically stimulated MCs in the absence (Figure 3B) and presence of 100 μM DIDS are observed. *P < 0.05.)

