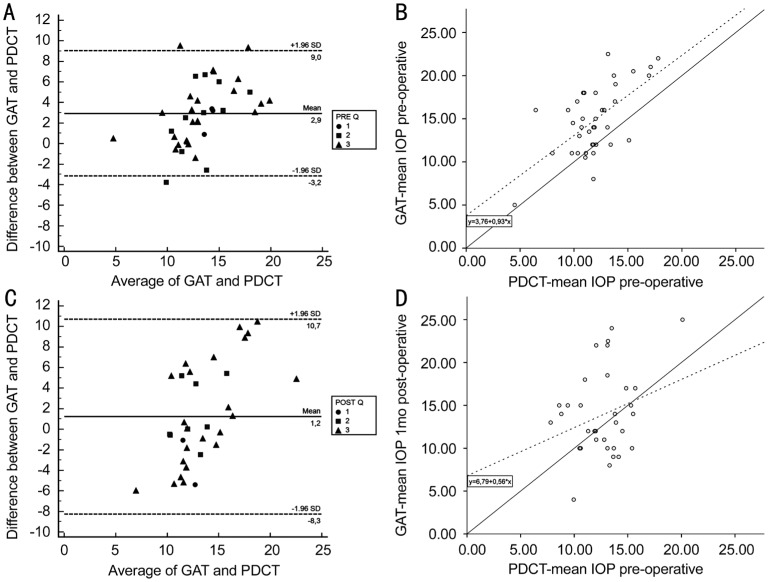
Figure 2. Bland-Altman plot of the difference in preoperative (A) and postoperative (C) intraocular pressure (IOP) between Goldmann applanation tonometry (GAT) and Pascal dynamic contour tonometry (PDCT) plotted against the average IOP, with corresponding scatterplot of the preoperative (B) and postoperative (D) average of GAT versus the average of the PDCT.
In the Bland-Altman plot the solid line represents the mean difference and the dashed lines represent the 95% limits of agreement. The quality of the PDCT measurements are shown as circles (Q1), squares (Q2), and triangles (Q3). In the scatterplot the solid line represents the line y=x. The dashed line represents the regression line.

