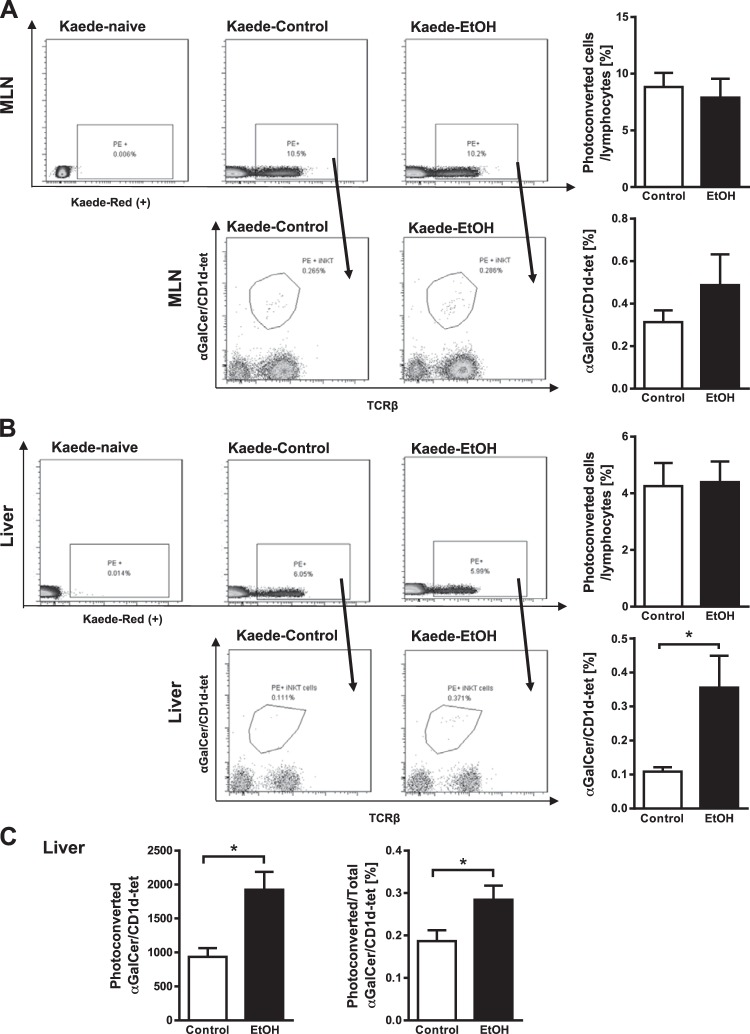
Fig. 1.
Tracking immune cell migration from mesenteric lymph nodes to the liver in Kaede-transgenic (Tg) mice after chronic ethanol feeding. Kaede-Tg mice were fed an oral control diet (n = 8) or ethanol (EtOH) diet (n = 8) for 8 wk following the chronic Lieber-DeCarli diet model. Photoconversion was performed in mesenteric lymph nodes (MLN), and livers and MLN were harvested after 48 h. Kaede-Tg naïve denotes Kaede-Tg mice that underwent surgery but did not undergo photoconversion. A: flow cytometry data of photoconverted CD45+ cells (top, gated from forward and sidescatter, as well as CD45+, then phycoerythrin+ (PE+), and photoconverted invariant natural killer T (iNKT) cells (based on αGalCer/CD1d-tet) in mesenteric lymph nodes (bottom, gated from all photoconverted CD45+ cells). Graphs on the right show the ratio of total photoconverted cells to CD45+ (top) and total photoconverted iNKT cells to total photoconverted cells (bottom). B: flow cytometry data of photoconverted CD45+ cells (top, gated from CD45+, then PE+) and photoconverted iNKT cells in livers (bottom, gated from all photoconverted CD45+ cells). Graphs on the right show the ratio of total photoconverted cells to CD45+ (top) and total photoconverted iNKT cells to total photoconverted cells (bottom). C: absolute numbers of photoconverted iNKT cells migrated to the livers (left) and percentages of migrated photoconverted iNKT to total hepatic iNKT cells (right). *P < 0.05.

