Fig. 4.
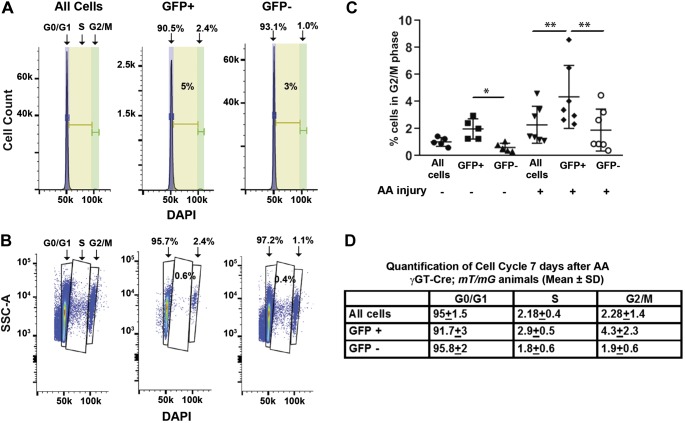
Cell cycle changes are more pronounced in injured green fluorescent protein (GFP)+ cells compared with all cortical cells. A: histograms of an uninjured mouse kidney show cell cycle data analyzed by the FlowJo algorithm with purple representing G0/G1, yellow representing S, and green representing G2/M. B: cell cycle data were also generated on the same mouse by gating side scatter (SSC-A) against DAPI on the same mouse. This second approach was thought to more accurately analyze the cell cycle as the percentage of cells in the S phase (0.6%) more closely fit the number shown by the cells in between the DAPI peaks and represented by the histogram in A than that determined by the FlowJo algorithm (5%). C: percentage of cells in G2/M is shown for all cortical cells, GFP+ cells, and GFP− cells from kidneys that are both uninjured (n = 5) and 7 days after aristolochic acid (AA) injury (n = 7). *P < 0.05 and **P < 0.01. D: each cell cycle stage is shown for AA-injured cortical tissue comparing gating on GFP+ cells (i.e., proximal tubules), GFP− cells, and all cortical cells. Differences in all cell cycle stages (G0/G1, S, and G2/M) in the injured kidneys were statistically significant between GFP+ cells and all cortical cells as well as GFP+ and GFP− cells with P < 0.01.

